March 1, 2019
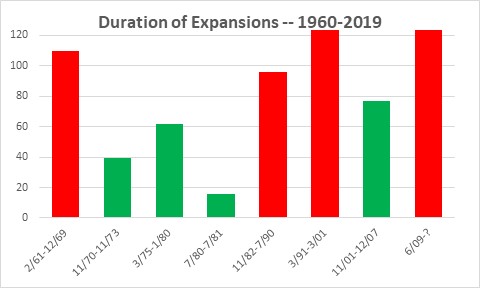
In four short months this expansion will go into the history books as the longest expansion on record and surpass the previous record holder which was the decade of the 1990’s. While that is a remarkable achievement, it is equally important to look ahead for danger signals that could bring about an early end to the current expansion.
From the mid 1859’s through early 1900’s the average business cycle consisted of two years of expansion (27 months) followed by two years of recession (22 months). Up. Down. Every two years. But then along came the Federal Reserve in 1913 and expansions have steadily grown longer and recessions shorter. Today the average expansion lasts 6-1/2 years (77 months) while recessions are only 1 year in duration (11 months).
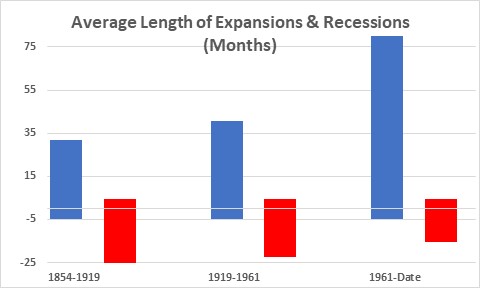
It turns out that the four longest expansions on record – with data going back to the civil war — have all occurred since 1960. The 1960’s, the 1980’s, the 1990’s, and now 2009 to date. That is not an accident. The Fed has progressively gotten better at managing the economy. Still, it is not perfect. There will always be recessions. But over the years the Fed’s policy decisions have made recessions both less frequent and shorter in duration.
It is accurate to say that every expansion grinds to a halt because the Fed raised rates to the point where, eventually, the economy goes over the edge. But it is also true that in each case the trigger for the Fed’s action was some factor that was pushing the inflation rate higher. Because the Fed’s job is to keep the inflation rate from spiraling out of control, it must take away the punch bowl just as the party gets going. To accomplish that it raises interest rates to both cool off the economy and bring the inflation rate back into alignment with its 2.0% target. Thus, the Fed becomes the catalyst for every recession, but it is not the underlying cause.
The current expansion will reach a milestone of 120 months in June and go into the history books as the longest expansion on record. Because there are still no signs that it is about to crack it will blow through that previous record not by months but by years. What are some of the underlying causes of recessions, and how do they look today?
A sharp rise in oil prices caused several recessions in U.S. history. Back in the early 1970’s, for example, OPEC countries imposed an oil embargo targeted at nations that supported Israel during the Yom Kippur war. Oil prices surged from $3 per barrel to $12. In the late 1970’s the Iranian Revolution reduced the global supply of oil, panic followed, and oil prices more than doubled from $14 per barrel to $39. Recessions followed in both cases.
Could a sharp rise in oil prices produce an untimely end to the current expansion? Not likely. Shale drilling in the past seven years has produced a dramatic increase in U.S. oil production. In fact, today the U.S. has surpassed both Russia and Saudi Arabia and become the world’s largest producer of crude oil. OPEC does not have the stranglehold on prices that it did when it was the dominant player in the 1970’s.
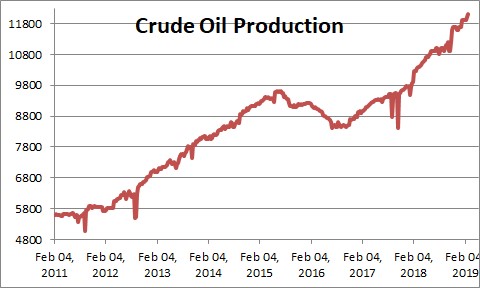
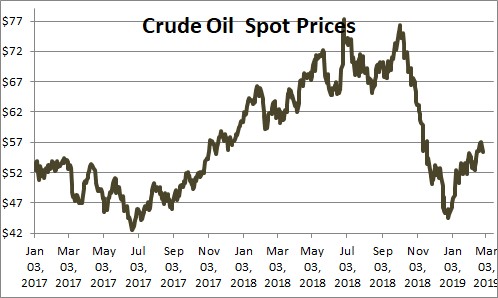
While OPEC countries would love for crude prices to climb from their current level of $55 or so to $85-90 per barrel that is not going to happen. The moment oil prices rise by any significant amount U.S. producers will step in quickly to boost production, alleviate the shortfall, and stem the increase in prices.
In the early 2000’s the housing market got overheated. Congress encouraged mortgage lenders to be less stringent in their requirements for lower income borrowers. Adjustable rate mortgages became fashionable. As a result, lenders made loans to a whole group of individuals that should probably never have become homeowners in the first place. Home prices rose dramatically, and housing became unaffordable for many. The quality of bank loans declined. Consumers became very highly leveraged. But none of those factors are evident today.
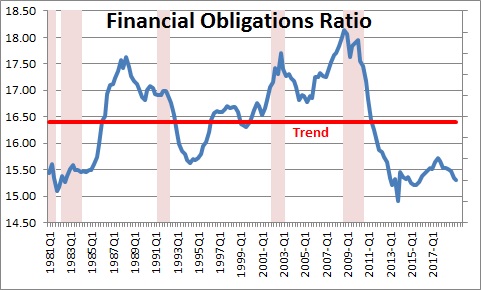
As credit became widely available and rates rose consumers became progressively more leveraged. Their monthly debt service payments as a percent of income climbed to a record high level. In the wake of the recession consumers paid down tons of debt and, as a result, debt payments in relation to income are the lowest they have been since the 1980’s.
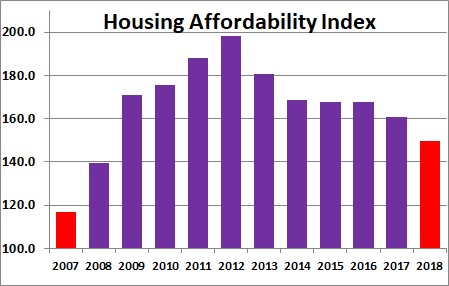
As a new group of first-time home buyers entered the market and rates rose, housing became unaffordable. At the onset of the 2008-09 recession potential home buyers had just 14% more income than was required to purchase a median-priced home. Housing was very expensive and unaffordable a decade ago. Today consumers have 50% more income than necessary. Housing remains affordable for most home buyers.
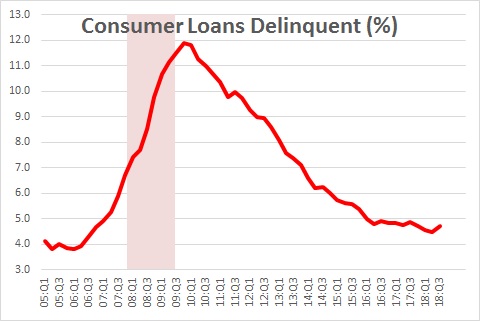
The Fed began to raise rates between 2004-2007 and adjustable rate mortgages re-priced upwards. Many consumers began to struggle and got behind on their payments for mortgages, auto loans, and credit card bills. But there is no evidence of that difficulty today.
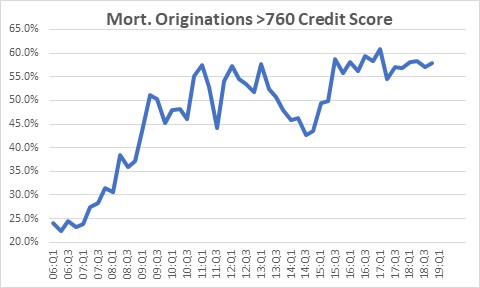
Meanwhile, banks were actively encouraged to seek out less qualified borrowers. Presumably every American had the right to own their own home. As banks reached to expand their mortgage portfolio, less than 25% of borrowers had a credit score above 760. But mortgage lenders today are far choosier and almost 60% of borrowers have excellent credit ratings. It is hard to make a case that banks are repeating their earlier bad behavior.
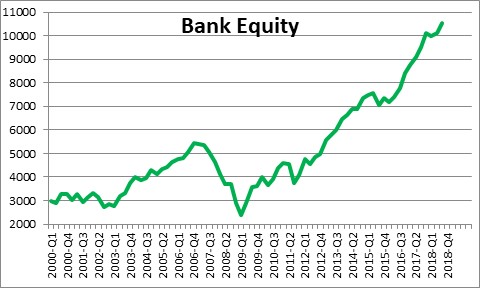
In the wake of the financial market crisis that occurred during the recession regulators have forced banks to increase their equity holdings which today are more than double what they were going into the recession, and leverage ratios are 40% lower today than they were at that time.
The point is that in July the current expansion will become the longest expansion on record and, as always, it is prudent to see if there are imbalances in the economy that might lead to trouble down the road. We do not seem them. As a result, we suggest that the current expansion will last at least another couple of years.
Stephen Slifer
NumberNomics
Charleston, S.C,
Steve
I love your analysis.
I am happy to have you as a valued friend.
Bill
I agree with your stats and conclusions in your well-written analysis. However, since fear and greed control markets and uncertainty is not helpful either, I see some problem areas which may upset the balance we have enjoyed since 1990, (excepting 2000-2002 and 2007-2010), as follows: 1. Great Britain-Brexit; 2. France-Les Gilets Jaunes; 3. Russia & Putin-Ukraine; 4. China & South China Sea; 5. Venezuela-Maduro & Guidó; 6. North Korea & Kim Jung Il.
Recession happens in most cases because of 2 things, inflation (like Stephen said, we don’t see any), asset bubble or excessive leverage (again, nothing stand out as an issue right now).
Although I argue that the ‘current expansion’ is growing at a rather tepid manner; the last time this happened, is probably Japan after the Asian crisis, which landed in a deflationary environment. Would you comment on this Stephen? Are we following Japan’s footsteps into a low-or-no growth era? Thank you.
Great write-up. Your site and my Economist subscription, the latter mostly for my geo-political penchant, are still my favorite “go to’s”… DMH
Thanks Dean. I really do believe the Fed is getting better and better at doing their job. Send a thank you note to Ben, Janet, and Jerome.
Hi Ray,
Since the election in November 2016 we had GDP growth of 3.1% in 2017 2.7% growth in 2018 and I am expecting GDP growth of 2.7% this year. This does not strike me as being a “low growth” environment like Japan had. They key will be investment spending. If it continues to growth at a 6.0%+ pace, productivity growth will quicken, and our economic speed limit will get higher. I am looking for it to climb from about 1.8% a couple of years ago to 2.8% by the end of this decade. Further, And we do not appear to be heading towards a deflationary environment. If anything, inflation is running at about the Fed’s desired 2.0% target now, but seems to be inching its way upwards, not downwards. I do not see a slow growth / deflationary environment emerging,but we all need to keep our eyes open for surprises.
You are certainly right that uncertainty and fear can change the game. And you have hit on lots of potential problems. If some of these things move to the forefront and we get nervous, the game could be over over. But as an economist I am uncomfortable weakening my forecast because of some potential problem somewhere around the globe. How could I explain to you all why I have lowered my forecast. We have fears about all sorts of things in the past decade and they can cause a temporary slowdown, but the economy then rebounds. That is OK. The economy never grows in a straight line. I think we all need to keep in mind that trade is 10% of the U.S. economy. Trade with Europe is about 15% of the 10%. We would need something dramatic to happen there to have much of an impact on GDP growth here. Now, if you tell me we are going to have a shooting match with China or N. Korea we have a different story.
Thanks Bill. Glad to see we are all continuing to think about things. Nobody has a lock on truth. Certainly not me. But perhaps, collectively, we can keep our eyes open and see some potential trouble spots. The expansion will end sometime. Hopefully we can see the trouble spots emerging before we get there.