February 10, 2012
The Congressional Budget Office (CBO) recently released its annual 10-year budget outlook. The budget deficits for 2014-2022 have been trimmed by about $100 billion per year, which reduces outstanding debt by nearly $1.0 trillion relative to what had been expected previously. On the basis of this report one might conclude that the budget situation has improved, and that the much-discussed budget deficit / debt outstanding problems are not as bad as the pessimists contend. That would be a seriously flawed conclusion. It is important to understand why.
This CBO document is widely interpreted as a budget “forecast”, but it is not. It is intended to be a “baseline” forecast against which various policy changes can be evaluated. In deriving such a document the CBO does two things:
1. It only looks ahead 10 years.
2. It assumes that current law exists throughout the entire 10 year period.
Using a slightly longer time period and slightly more realistic assumptions the debt problem becomes far more acute.
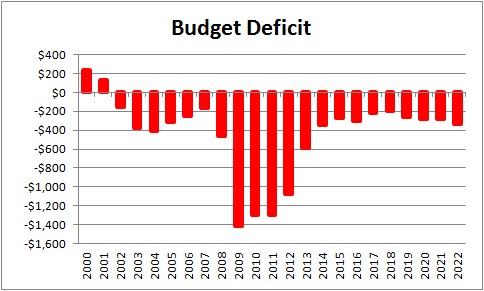
The 10-year budget forecast presented by the Congressional Budget Office is shown below. The budget deficit for fiscal year 2011 which ended on September 30 came in at $1.3 trillion, about the same as in the two previous years. It is expected to shrink to $1.1 billion this year. Between 2014 and 2022 it should average about $300 annually — which happens to be about $100 less than the forecast done a year ago.
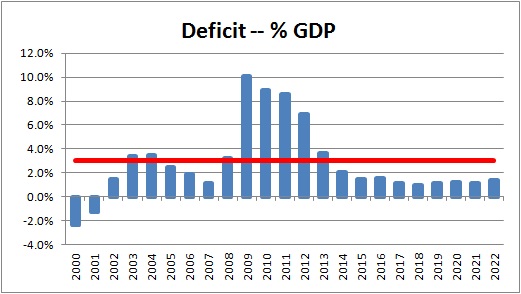
Whether those budget deficits are big or small can only be evaluated by comparing them to the size of our economy. Bigger countries can obviously afford larger deficits than small ones. Hence, economists typically look at the budget deficit as a percent of GDP. It is generally accepted that a deficit to GDP ratio that averages 3% over the course of a business cycle is acceptable. Using that metric, budget deficits for the current business cycle appear a bit high, but not dramatically so.
It is also important to understand that whenever a country incurs a budget deficit, it must borrow and issue an equivalent amount of debt to finance that deficit. For example, in the 2011 fiscal year the Treasury had to issue $1.3 trillion of additional debt to finance the $1.3 trillion budget deficit. Thus, debt outstanding represents the cumulative impact of all previous deficits. With budget deficits projected for every year between now and 2022, the amount of debt outstanding grows continuously and reaches $15 trillion by 2022.
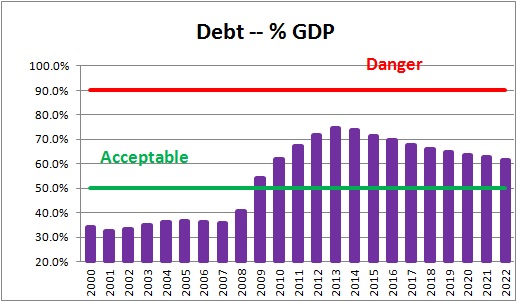
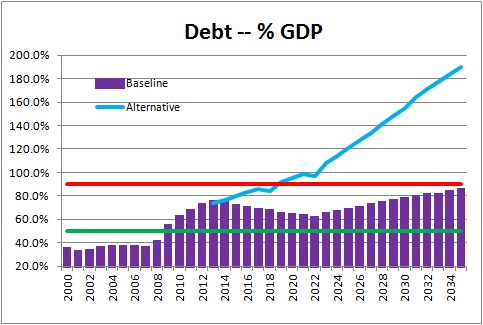
But, once again, any given level of debt must also be evaluated as a percent of GDP. In this case, economists generally believe that a debt to GDP ratio of 50% is sustainable, but a ratio in excess of 90% of GDP it is almost certain to be a problem. At that point investors will worry about a country’s ability to pay back that debt, interest rates will rise, the government’s interest expense increases, and the budget gap widens. Reducing budget deficits and debt in that environment becomes far more challenging. Just ask Greece or Italy.
Over the next ten years the debt to GDP ratio is higher than one might like, but not even close to the so-called “danger” level. At the end of the 10-year time horizon, that ratio is projected to be 61.4%. For the next decade U.S. debt appears to be manageable.
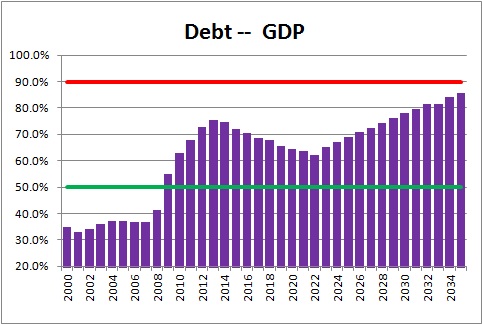
However, if one looks ahead 25 years rather than just 10, the debt problem becomes more troublesome. Beginning in 2023 the ratio of debt to GDP climbs steadily. Twenty-five years down the road in 2035 the ratio is expected to climb to 84%. While the debt to GDP ratio is not yet at the 90% danger threshold, it is obviously close. This rising debt level is primarily a function of an aging economy. The baby boomers are getting older. As they retire they start to receive Social Security payments and become eligible for Medicare. There is nothing that can be done to change the demographics.
The more troublesome part of the CBO’s recent analysis stems from the assumption that current law applies throughout the entire forecast period. While that is a necessary assumption to simplify the analysis, there is no chance that will actually happen.
For example, at the end of this month the payroll tax, which funds Social Security, is scheduled to rise. If that happens more money will be taken out of employee paychecks and disposable income will decline. Similarly, at the end of this month the maximum period of time that combined federal and state long-term unemployment benefits can be paid will be cut from 99 weeks to 79 weeks. Finally, Social Security payments to physicians are scheduled to be cut 27% at the end of February. None of this is going to happen. This is an election year. With the economy just beginning to shift into a higher gear and with the unemployment rate still very high, Congress is not going to allow these laws to take effect and thereby slow the pace of economic activity.
If Congress changes these laws, tax revenues in the years ahead will be reduced and expenditures will be higher. Acknowledging these likely changes and other similar measures, the Congressional Budget Office has developed an alternative, and far more onerous, budget forecast. In the “baseline” case the CBO concluded that the debt to GDP ratio would climb to 84% by 2035. Under the “alternative” scenario, shown below, that ratio skyrockets to 190% by 2035 and blows through the so-called 90% danger level. Most economists believe that this alternative scenario reflects a far more accurate picture of the debt difficulty the U.S. is facing. Yike!
Even though the near-term budget outlook has improved in the past year because of higher tax receipts, the longer-term outlook remains as ominous as ever. Because these debt problems do not become readily apparent for another decade, lawmakers can easily kick the can down the road and defer substantive action to a later late. But by doing so the adjustments required to shrink the budget deficits and reduce debt to a more sustainable level will be far more wrenching.
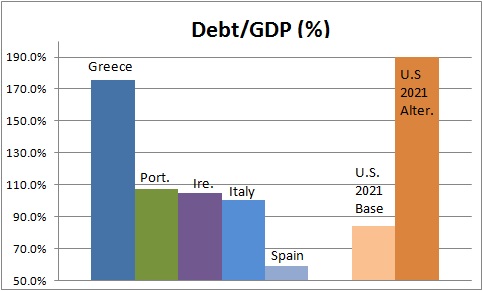
To highlight the importance of this issue, the chart below compares the two alternative debt scenarios for the U.S. in 2035 – 84% versus 190% — to debt to GDP ratios for various European countries that are currently experiencing debt woes. The similarities are painfully obvious. We need to encourage our policy makers to do something now.
Stephen Slifer
NumberNomics
Charleston, SC

Follow Me