August 17, 2018
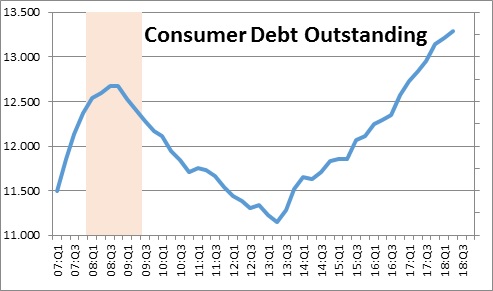
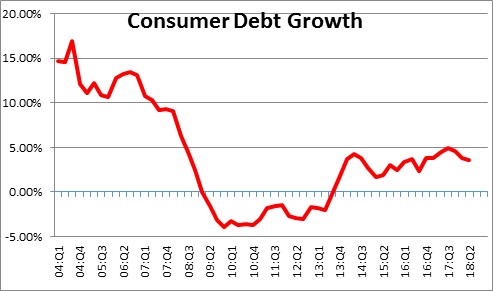
The Federal Reserve Bank of New York released its quarterly report on consumer debt which rose $82 billion in the second quarter to $13.3 trillion. This was a record high level and some analysts suggest that if this continues it will eventually be a problem for our consumer driven economy. Nothing could be further from the truth. Indeed, we suggest that it is a healthy sign for the economy.
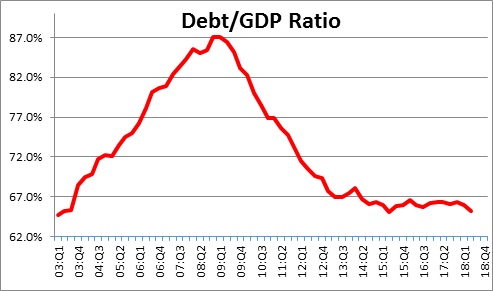
The level of consumer debt is important, but the real question is whether the consumer can afford it. One way to determine that is to look at the relationship between consumer debt and nominal GDP (which is a measure of income). That percentage today is 65%. It has been flat at about that level for the past five years. It also happens to be where it was when the New York Fed began to collect these statistics in 2003.
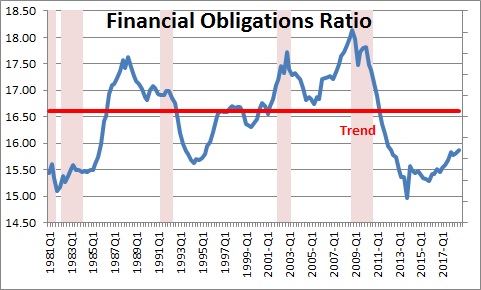
The Board of Governors of the Fed has a slightly different measure known as the consumer’s financial obligations ratio which looks at payments on all types of consumer debt — mortgages, consumer installment debt, automobile lease payments, rent, homeowners’ insurance, and property taxes — in relation to income. This measure has risen slightly in the past couple of years but remains far below its average over the past 40 years of 16.6%.
Keep in mind that total household debt grew 3.5% rate in the past year. In the past year nominal GDP (or income) climbed by 5.4%. Thus, consumers are proceeding cautiously and not taking on debt faster than their income is growing. Thus, we believe that the willingness of consumers to borrow reflects confidence that the economy will continue to expand for another couple of years, and that they will have a job throughout that period. That is a good thing.
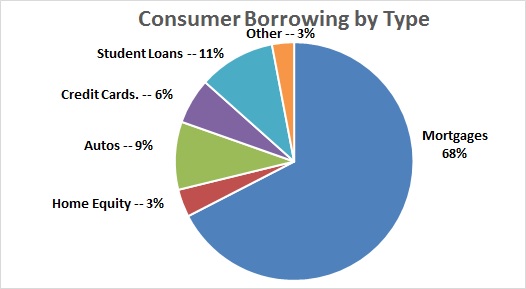
Of the various types of consumer debt, the big gorilla is mortgage debt which accounts for 68% of the total. During the past year, mortgage debt outstanding – like total household debt – grew 3.5%. Most other categories of consumer borrowing — auto loans, credit card balances, and student loans all grew at modest rates between 3.5% and 5.5%.
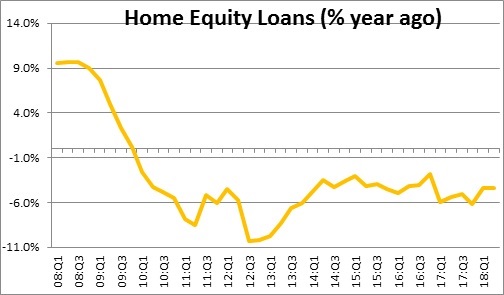
The only category of consumer borrowing that did not grow during the past year is home equity lines of credit which declined 4.4%. This is not new. Home equity lines have been steadily declining since the recession ended nine years ago. Given the extent to which home prices fell during the recession, homeowners have chosen to pull back sharply on the outstanding balances of their home equity lines of credit.
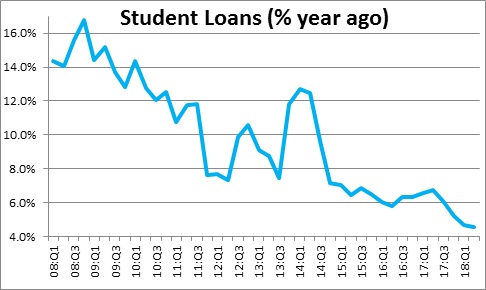
Right after the recession student loans grew at a double-digit pace for five years as students, unable to find a job, remained in school. But because the economy has improved, most of them have found jobs, and the cost of a college education has escalated student loan growth this past year has continued to slow to 4.5%.
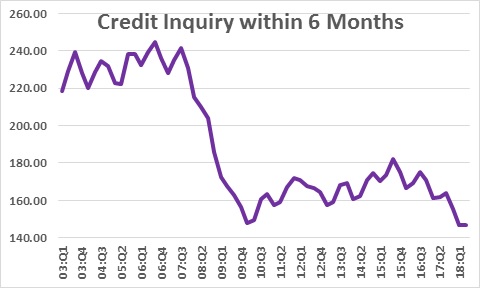
The New York Fed also reports the number of credit inquiries in the past six months which it interprets as an indicator of the consumer’s demand for credit. It was roughly flat and remains among the lowest seen in the 19-year history of the data.
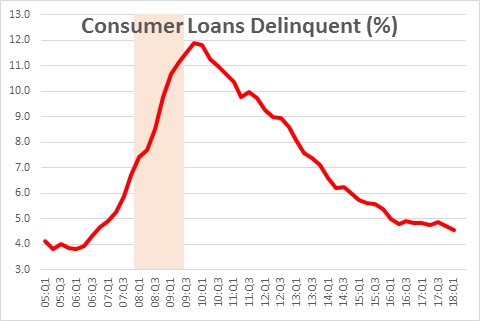
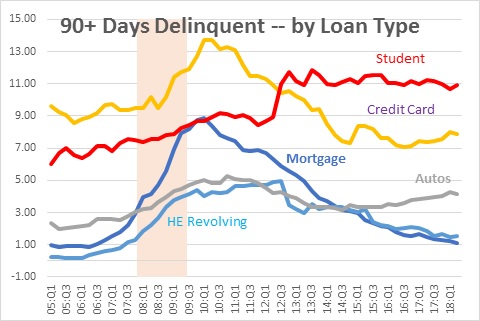
Finally, the percent of loans that are more than 90 days delinquent has been trending downward for the past several years.
That steady decline is most evident for mortgages and home equity lines of credit where delinquency rates have been falling steadily for years. Student loan delinquencies are still the highest at 11.0%, but that percentage has not changed appreciably in the past six years.
It is true that consumer debt outstanding has been growing and now stands at a record high level. But growth in that debt has been in line with consumers’ growth in income and they are easily able to afford the monthly payments. Furthermore, delinquency rates continue to decline which indicates that consumers are having no difficulty with a record level of debt. The financial press and economists in general continue to struggle with the notion that the economy is not only doing well, it is likely to continue growing at a sustainable pace for the foreseeable future.
Stephen Slifer
NumberNomics
Charleston, S.C.
Always excellent and apolitical analysis.
Thanks Sidney.
debt outstanding – at record level
growth in debt – in line
Surely it implies that the limit is near, not able to access more or can’t pass the affordability; either way the economy growth nears peak.
That’s how I interpret what you analysed, from an extended angle.
If jobs keep climbing and wages continue to rise, the consumer can keep on spending. I do not get a sense that consumers, in general, are having a hard time getting debt. That is obviously not true for every consumer, but for the vast majority. And, looking at the charts I provided, the consumer’s ratio of debt to income is very low. We can afford what we have. I think the consumer can keep spending for some time to come.
Thanks Steve, great insight again!