October 9, 2015
Sometimes it is easy to get lost amongst the trees and miss the bigger picture. In economics we focus on the latest tidbit of information or the latest wiggle in the stock market. And, more often than not, bad news gets a lot more attention than it deserves. Sometimes bad news really is bad news. Most of the time it is a blip on the radar screen which carries little, if any, economic significance. Knowing the difference between the two is challenging.
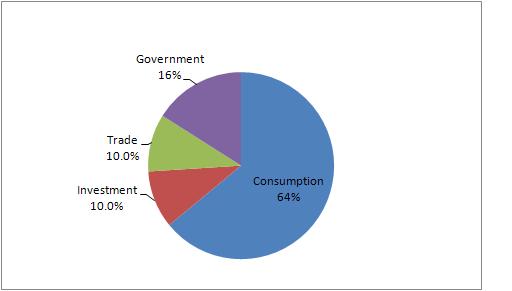
What makes assessment of the economy so difficult today is that growth varies widely amongst sectors. Consumer spending, which is 70% of the GDP pie is doing fine. It is being supported by a reasonably robust pace of jobs creation and lower oil prices.
The trade sector, which is about 10% of GDP, is getting hit hard by slower growth in China and elsewhere in Asia, and by the strength in the dollar. And because three-quarters of U.S. exports are goods, the manufacturing sector is taking the brunt of the hit. Within manufacturing sector the oil sector is also getting hit by the sharp drop in oil prices.
As economic indicators related to manufacturing or trade are released the negative nature of the report makes investors nervous which causes the stock market to slide, which generates still more negative headlines. It is easy to get sucked into a trap of believing that the economy is teetering on the brink of the next recession. At moments like that it is important to evaluate the news in context.
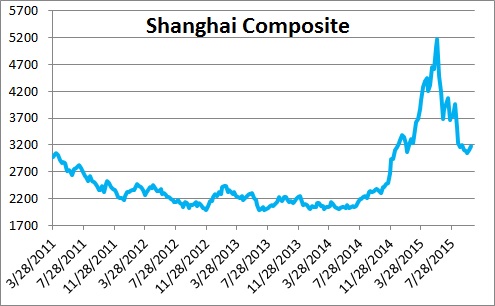
For example, slower growth in China and other emerging countries has triggered a precipitous slide in the Shanghai Composite Index. The index has dropped 40% from its early June peak and that scares stock investors around the globe. But the index rose 135% between August of last year and June. Its level today is still 35% higher than it was at this time last year. For the press to focus on the recent precipitous slide in the Shanghai Index, knowing full well the impact it will have on stock markets around the globe, and not at least note the dramatic increase during the previous 10 months, is not fair reporting.
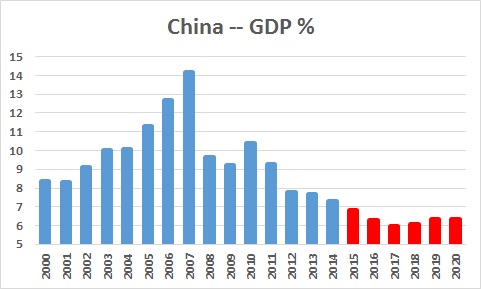
There is no doubt that GDP growth in China is slowing down. According to the IMF growth is expected to slow from 7.3% last year to 6.8% this year and 6.3% in 2016. Many economists question the validity of the data which is valid – to a certain degree. But remember that we already have eight months of data from China for 2015 and the growth slowdown thus far appears moderate. It may be off the mark, but probably not dramatically so.
Stories about slower growth in China and the strength of the dollar invariably cite the negative impact on U.S. exports. Clearly, trade-related firms are suffering. But it is important to remember that the entire trade sector represents 10% of GDP. Trade with all Pacific Rim countries is 25% of that amount or 2.5% of GDP. If growth in all of our trading partners were to slow by 1.0%, it would reduce U.S. GDP growth by about 0.1%. A stringer dollar also makes imported goods cheaper for Americans to buy. Thus, faster growth in exports can compound the effect. Can slower growth outside the U.S. retard GDP growth by 0.2-0.3%? Yes. Can it sink the ship and push us into an early recession? Not a chance.
The drop in oil prices has sharply curtailed spending amongst oil-related firms and has had a significant negative impact on GDP growth during the past several quarters. But no one bothers to point out that oil prices seem to have stabilized. If that is the case, the drag on GDP growth from lower oil prices has probably run its course.
One final example. The employment report for September was unambiguously weak. Economists quickly marked down their third and fourth quarter GDP estimates. They delayed a Fed rate hike until March. But be careful. This report does not square with other things that we know about the labor market. First of all, if it was truly weakening shouldn’t we expect unemployment claims to begin to rise? That has not happened. Second, the ADP employment report, which is closely related to the official data, showed a solid increase of 200 thousand in September. And couldn’t it be that there really is legitimately slower jobs growth because there is a growing scarcity of qualified workers? Something doesn’t fit.
The point is that economic indicator releases should always be interpreted with several grains of salt. First of all, the initially-reported data are often revised. Subsequent revisions can change the entire picture. Second, some data are notoriously volatile. Boeing can get a huge aircraft order one month which produces a double-digit increase in orders. The following month when orders return to a more normal level we see a double-digit decline. We need several months of data to determine if there has been a change in trend. Third, be aware of the biases of the news source you are reading. The Wall Street Journal does not like Obama and seems to see the dark side of almost every economic indicator. The New York Times interpretation is often quite different. Assessing the pace of economic activity is never easy and there is always room for different opinions. But try to reserve judgement when an indicator is way out of line with expectations. Most of the time it will be some sort of an aberration.
Stephen Slifer
NumberNomics
Charleston, SC


A breath of fresh economic truth…Thanks.