April 25, 2018
Home prices have suddenly begun to surge. Ditto for oil prices. Uh-oh! Is this a sign that the inflation rate is poised to accelerate? Slightly perhaps, but we are not yet ready to sound an alarm. Here’s why.
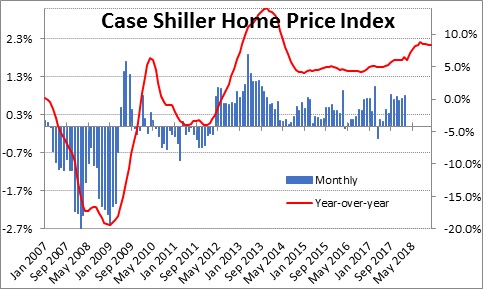
The Case-Shiller Index of home prices has begun to accelerate. In the past year home prices have risen 6.8%, but in the past six months they have surged to a 9.0% pace.
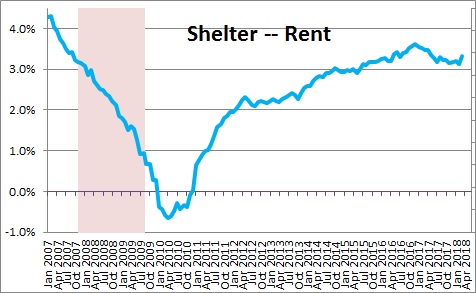
Home prices could filter into the inflation rate through the “shelter” component of the CPI. But “shelter” is a measure of rent. It includes rent on rental properties and “owner’s equivalent rent”, which is how much you could get for your house if you chose to rent it. Rents are rising at a 3.2% pace but — unlike the Case Shiller index — they are showing no sign of accelerating. House prices may be rising rapidly but, thus far at least, rents have been relatively stable.
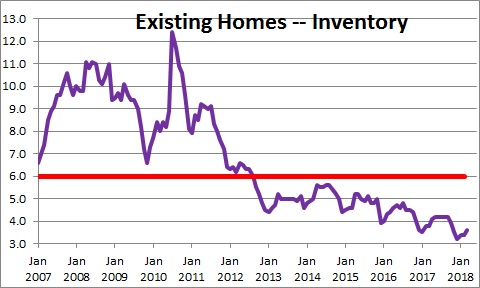
What is causing the rapid increase in house prices? A shortage of homes available for sale. There is currently a 3.6-month supply. Demand and supply should be roughly in balance when there is a 6.0-month supply. We are not even close.
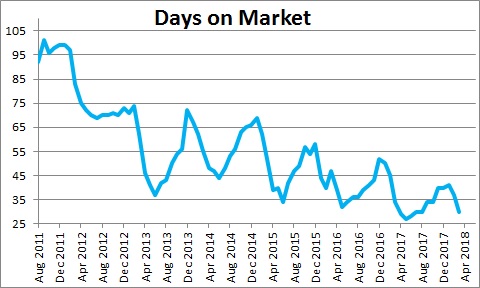
Clearly demand is hot. The average home is sold in just 30 days. That is the shortest amount of time between listing and sale since the National Association of Realtors began keeping these statistics in 2011.
On the supply side builders continue to have difficulty finding both skilled and unskilled workers. They have trouble finding available lots and must comply with a variety of newly imposed regulations designed to impede the growth of new housing developments. The imbalance between the demand for and supply of houses is unlikely to change any time soon.
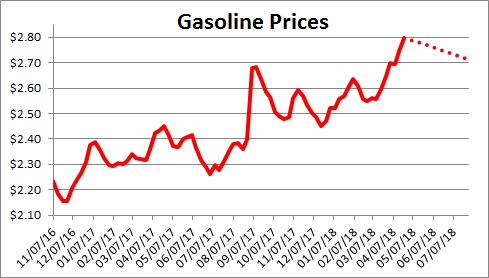
The other sector of the economy where prices have begun to rise rapidly is oil. Gasoline pump prices were $2.55 in mid-January. They have now risen 10% to $2.80.
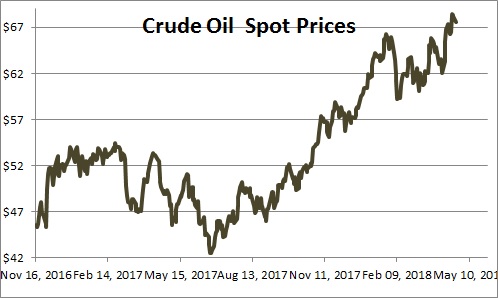
Crude prices have climbed from $57 in mid-January to $68, an increase of almost 20%.
In both cases the run-up in prices seems to be partly economic as demand exceeds supply, and part political as OPEC has talked about extending its production cuts through the end of next year.
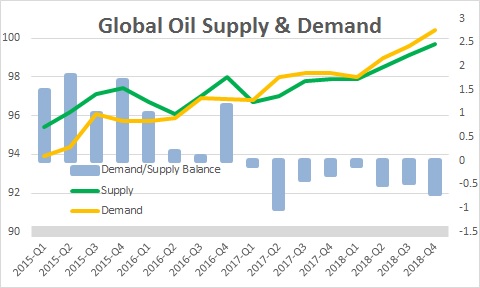
With respect to the supply/demand imbalance the International Energy Agency in Paris (IEA) produces forecasts of global demand and supply. In January it expected supply and demand to be relatively in balance for the foreseeable future, but recently demand has picked up while supply has shrunk. As a result, the IEA now estimates that demand will exceed supply by about 0.5 million barrels per day between now and yearend. Clearly, the increase in demand reflects robust GDP growth not just in the U.S. but globally. Some of the production shortfall has been caused by complete mismanagement of oil production in Venezuela where output has fallen to a multi-decade low. Routine field maintenance has constrained supply in other countries. Thus, some of the reduction in the global supply of oil may prove to be temporary.
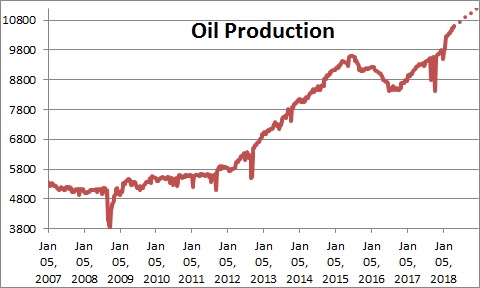
As oil prices have risen U.S. production has soared. Given that drillers can pull oil out of the ground at about $48 per barrel, current prices will encourage them to open previously closed oil rigs and quickly boost supply. The Department of Energy expects production to quicken from 9.3 million barrels last year to last year to 10.7 million this year. At some point the pickup in U.S. production is likely to counter the cutback by OPEC and prices should begin to fall. The Department of Energy expects oil prices to average $59.37 this year.
On the political front, OPEC ministers recently suggested that the group could choose to extend the production cuts through 2019 or even trim them further. That got the markets worried about oil prices climbing to, perhaps, $80. Saudi Arabia is focusing on high prices in the near term to cover domestic spending. Higher prices have also increased Russia’s role as a power broker in the mid-East. Thus, the oil market remains embroiled in politics as much as in matters of supply and demand. In our view, the rapid increase in U.S. production should prevent oil prices from spiking to the $80 mark.
While house prices and oil prices seem likely to push inflation higher, technology should continue to exert an important downward bias. The internet has played a huge role in reducing the prices of many goods. Shoppers can instantly check the price of any item across a broad array of both online and brick and mortar stores. Retail merchants are constantly competing with prices available on the internet. As aa result, prices have fallen for almost every major category in the past year. New cars have fallen 1.3%, appliances 2.2%, televisions 14.3%, audio equipment 17.6%, toys 8.5%, information technology commodities (personal computers, software, and telephones) 3.2%. Prices for all these items are widely available on the internet.
Because of the internet there is now a dichotomy between the prices of goods (excluding the volatile food and energy components) and services. For example, in the past year prices for goods have fallen 0.3% while prices for services have risen 2.9%.

When we put all of this together, we believe that inflation is headed higher, but perhaps not by a lot. For example, we expect the overall CPI to increase 2.5% this year versus 2.1% in 2017, and the so-called core rate to rise by 2.4% compared to 1.8% last year. Thus, inflation is clearly on the rise.
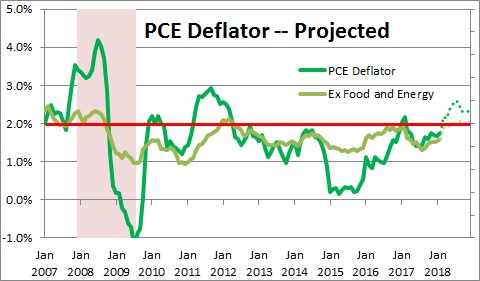
The CPI is, in our opinion, the best overall measure of inflation, but the Fed’s 2.0% target is for the personal consumption expenditures deflator (excluding food and energy). It tends to rise more slowly than the CPI. For that inflation gauge we look for a 2.0% increase this year versus 1.5% in 2017 – but that is exactly in line with the Fed’s 2.0% inflation target. Rather than be alarmed by this development it is probably thrilled because this measure has been far below target for a protracted period.
Stephen Slifer
NumberNomics
Charleston, S.C.
Follow Me