September 18, 2015
The Fed chose not to raise rates in September. But make no mistake, higher interest rates are coming. The debate can perhaps best be summarized by examining something called “potential GDP”.
“Potential GDP” is the volume of goods and services the economy could produce if everyone who wanted a job had one, and if our factories were humming along at full speed. It represents our longer-term economic speed limit.
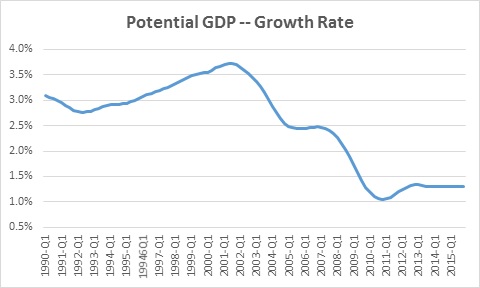
Back in the 1990’s potential growth had been rising at about a 3.5% pace. Today it has slowed to about 1.25%. Why?
The calculation of potential GDP is straightforward. It is the sum of two numbers – growth in the labor force and growth in productivity. That makes sense. If we know how many people are working and how efficient they are, we should have some idea of how many goods and services they can produce.
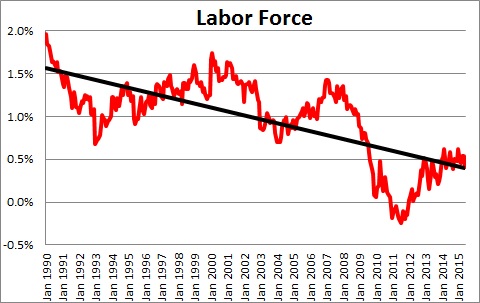
The first component of the equation, labor force growth, has slowed from 1.5% or so back in the 1990’s to about 0.5% today. For the most part that reflects the baby boomers beginning to retire. Because it is based on demographics it is fairly easy to estimate. Most economists expect the labor force to continue to grow at a 0.5% pace in the years ahead.
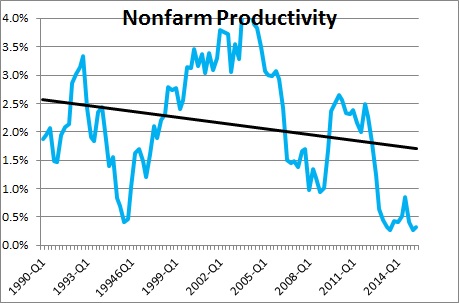
The second component, productivity growth, has slowed from 2.0% back in the 1990’s to about 0.8% today. But its growth rate is far more erratic and, hence, more difficult to estimate for the years ahead.
Thus, in the 1990’s we had labor force growth of 1.5% and productivity growth of 2.0%, hence potential GDP growth was about 3.5%. Today we have labor force growth of 0.5%, productivity growth of 0.8% and potential GDP growth of about 1.3%. That is a slowdown of more than two percentage points. But what really matters is the relationship between the two.
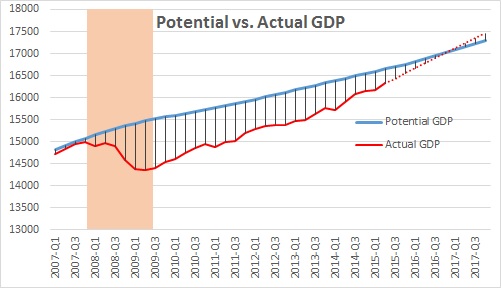
The Fed’s goal is to keep actual GDP in line with potential. During a recession workers get laid off, the pace of manufacturing activity slows, and actual GDP falls below potential. As a result, there is “slack” in the economy. In that situation the Fed then does all it can to stimulate growth. It lowers interest rates. During the Great Recession, for example, the Fed cut short rates to 0% and they have been there since. The Fed introduced an innovative bond buying program to lower long-term interest rates.
If actual GDP growth exceeds potential growth the gap between the two narrows. As that happens the unemployment rate falls. Factory utilization rates rise. The degree of slack in the economy gradually disappears. With actual GDP growth today of 2.5% and potential of 1.3% the output gap has been steadily shrinking and should soon disappear. But that creates another problem. With no remaining slack in the economy, if actual growth continues to exceed potential then the economy is growing too quickly and inflation will soon begin to emerge. Firms want to hire more workers than are available. To attract the requisite number of workers they offer higher wages and/or more attractive benefits. To offset the higher labor costs firms begin to raise prices. At full employment factories are running at peak capacity. If demand continues to be robust manufacturers will be tempted to boost prices. Inflation starts to climb.
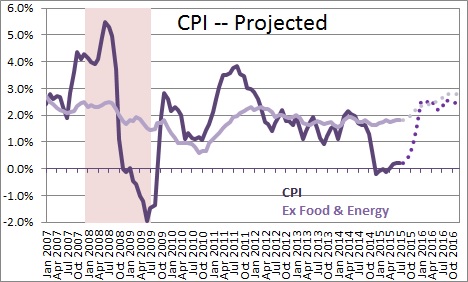
Economists and Fed officials today all believe there is little remaining slack in the economy. They concur that higher rates are in store. But because inflation has remained dormant thus far the Fed has chosen to postpone the initial rate hike. But inflation has recently been kept in check by the sharp drop in oil prices. Once oil prices stop falling the underling “core” rate of inflation will emerge which could be above the Fed’s 2.0% target.
For now the lack of increase in the inflation rate has allowed the Fed to postpone the inevitable first rate hike. But make no mistake it is coming soon.
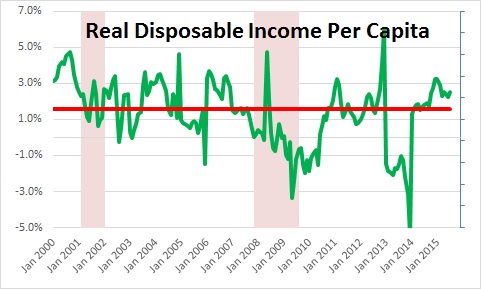
Others worry that the slower rate of potential growth implies slower growth in our standard of living. That is an intuitively appealing argument but, thus far at least, it is difficult to support. The best measure of our standard of living is growth in real disposable income per capita. Over the past 25 years it has risen at an average rate of 1.6%. Today it is rising at a 2.5% pace. Why hasn’t it slowed? The answer seems to be that lower tax rates have contributed to faster growth in “disposable”, after tax income. So while potential GDP growth has slowed one should not be too quick to conclude that our standard of living has suffered.
Stephen Slifer
NumberNomics
Charleston, S.C.
Follow Me