March 30, 2018
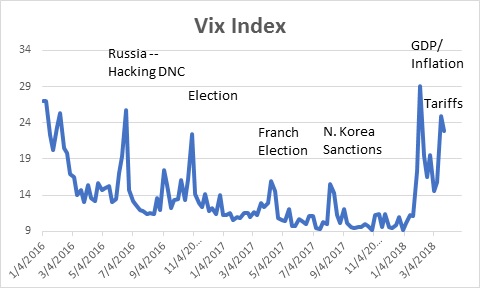
It has been a tough quarter. Early on there was fear that the economy was overheating and that inflation was on the rise. That triggered the long-awaited stock market correction. In early March President Trump imposed tariffs on all steel and aluminum imports. A couple of weeks later he homed in on the Chinese and imposed tariffs on a wide variety of Chinese goods. At that same time the Fed, under new leadership, raised short-term interest rates and indicated a willingness to quicken the pace of rate hikes. A week later there was the Facebook flap that brought into question exactly what it and other tech giants like Amazon and Google are doing with the data they collect from us. Market volatility has surged. But is the stock market slide and heightened volatility indicative of anything more than the usual stock market angst? Could they be early indications of economic distress? We suggest it is market noise and nothing more than a bump along the economic road.
Following a steady increase for more than one year, the stock market ran out of steam on February 2 when the January employment report registered another strong gain and average hourly earnings recorded a larger-than-expected increase for the month. Suddenly the fear emerged that the economy was overheating, inflation was on the rise, and the Federal Reserve would boost rates four times this year rather than three. That combo triggered the first stock market correction in three years.
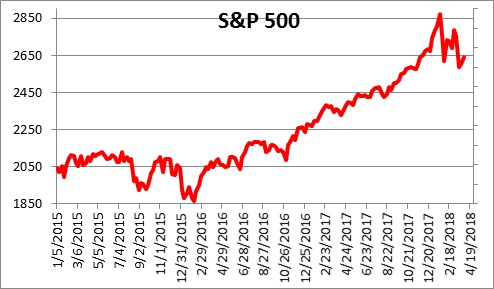
The market quickly recovered about one-half it its earlier loss as buy-the-dip mentality prevailed. But then it got clunked anew by the two tariff announcements and Facebook which sent the stock market into another tailspin. Daily changes in the DOW Jones Industrial Average of 500 points became common. Market volatility returned with a vengeance. But does any of this mean anything for the future of the economy?
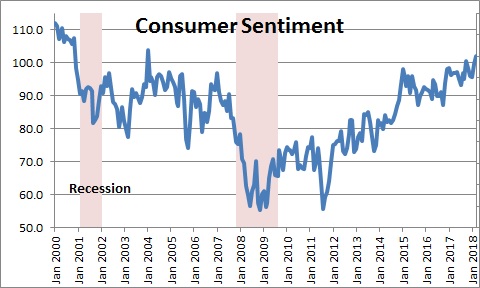
One way to gauge the impact would be to look at changes in consumer confidence. The University of Michigan series may prove to be helpful. It provided a mid-month reading on consumer sentiment for March on Friday, March 16. At that time it indicated that consumer sentiment for the month was 102.0 which was the highest level since January 2004. Two weeks later its final estimate of sentiment for March was 101.4. This suggests that sentiment in the first half of the month was 102.0 and in the second half it slipped to 100.8. At 101.4 sentiment for the month was still the highest since January 2004. So while the stock market has been bouncing all over the place and making investors nervous, consumers believe that job gains will continue at a brisk pace for the foreseeable future, the Fed will raise interest rates further but the rate of increase will be slow, and they envision inflation remaining stable at a 2.7% pace – an expectation that has not changed appreciably for the past three years. In short, they have largely shrugged off the events described previously.
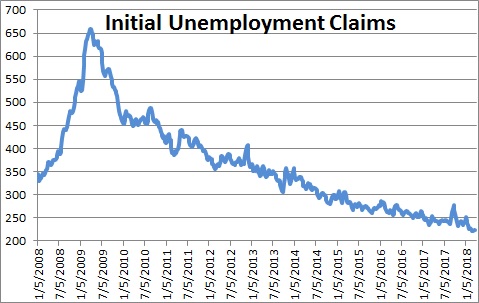
Another frequent indicator is the weekly level of initial unemployment claims which is a measure of layoffs. Initial unemployment claims declined 12 thousand in the most recent week to 215 thousand which is the lowest weekly level of claims since January 27, 1973 – that is 45 years ago! It is hard to see any emerging weakness in the labor market. This suggests that the employment report for March will be solid with the possible caveat of some temporary softness induced by the series of snowstorms that paralyzed the Northeast for much of the month.
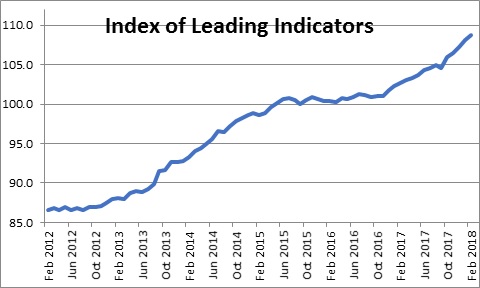
Also, the Conference Board publishes the most widely recognized index of leading indicators. This series rose 0.8% in January and an additional 0.6% in February. It has been marching steadily higher for years and nothing appears to have changed in recent months.
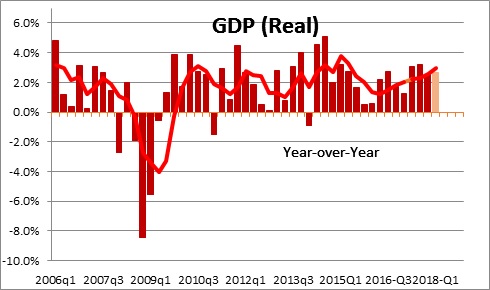
Finally, on Friday, April 27, we will get our first glimpse at first quarter GDP growth. While there is still some missing data, most estimates remain centered on a 2.5% pace with noteworthy strength in investment spending. If that estimate is correct it means that in the most recent four quarters GDP growth has averaged 2.9% which would be the fastest 4-quarter growth rate since mid-2015. While some of the first quarter passed prior to the stock market swoon, February and March data could have been impacted but, thus far, there seems to be little evidence that the pace of economic activity has been harmed in any meaningful way.
There will come a time when a stock market drop and additional volatility will be a leading indicator of emerging economic weakness. But that time is unlikely to occur until 2020 or beyond once the Fed has pushed the funds rate significantly above the 3.0% mark. At that point we should look for car sales and home sales to slide, factory orders begin to drop, and layoffs start to climb. None of those things are happening currently. For now, the stock market selloff and the sharp jump in volatility appear to be noise and not a harbinger of slower economic activity in the months ahead.
Stephen D. Slifer
NumberNomics
Charleston, S.C.
Thank you for your insight and explanation. I really appreciate it.
Darrel