May 9, 2025
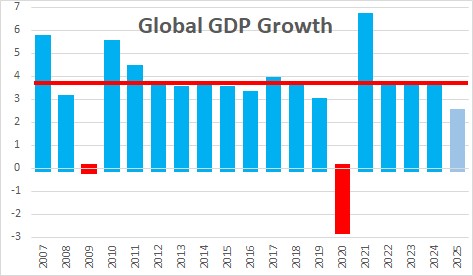
The tariffs imposed by the U.S. and the countermeasures employed by its trading partners are a hot topic of discussion amongst economists, business leaders, consumers, and investors in the U.S. While estimates of the magnitude, breadth, and duration of the tariffs vary, there is widespread agreement that they will reduce growth in 2025. The U.S. is not alone. Every country around the globe will be affected. In October, January, and April, the I.M.F. publishes forecasts of GDP growth for every country throughout the world. The April 2025 forecast released this past week indicated that global growth would slow sharply from 3.5% in 2024 to 2.4% in 2025. The 2025 forecast was reduced 0.8% from 3.2% in January to 2.4% as Trump’s tariffs and the responses to them were announced. Global growth of 2.4% is far below the 2000-2019 historical average global GDP growth rate of 3.7%.
For the U.S. the I.M.F. expects GDP growth of 1.5% (Q4/Q4) in 2025 compared to 2.5% in the prior year. We expect growth of 1.9% in 2025 which is roughly in line with the I.M.F. but, as nearly as we can tell, the consensus is for growth of just 0.8%. Also, by way of comparison, the I.M.F. expected growth in the U.S. this year of 2.4% in January so the imposition of tariffs has reduced growth by 0.9% relative to what it expected just three months ago.
Because their economies are far more open and trade accounts for a much bigger share of GDP, the I.M.F. chopped growth even more sharply for each of our top four trading partners.
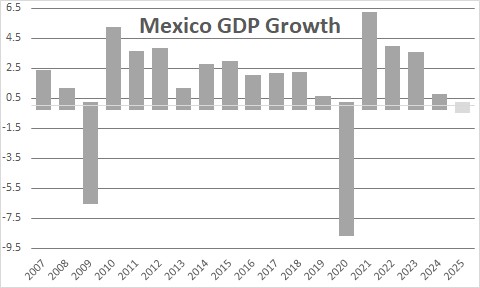
Based on the sum of exports and imports, our biggest trading partner currently is Mexico. In January the I.M.F. expected growth in Mexico in 2025 of 1.4%. After incorporating the latest data on tariffs the I.M.F. now expects a 0.2% decline in GDP in Mexico. That is an enormous downward revision of 1.6%.
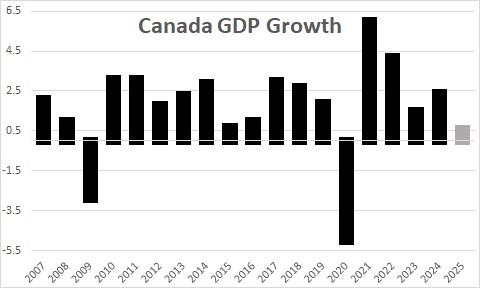
Our second largest trading partner is Canada. In January the I.M.F. expected GDP growth in Canada this year of 2.1%. It now stands at 0.6%, a downward revision of 1.5%.
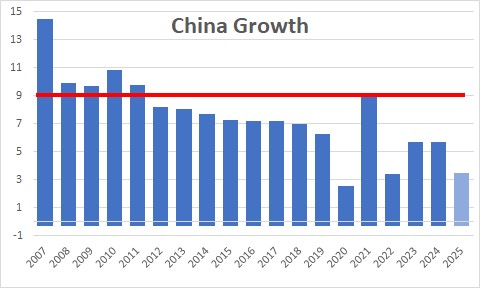
Third on the list is China. In January the I.M.F. expected Chinese GDP growth of 4.5%. Today it stands at 3.2%, a downward revision of 1.3%. To put that into perspective historical growth in China (2000 – 2019) was 9.0%. Projected growth for 2025 is one-third of its historical average.
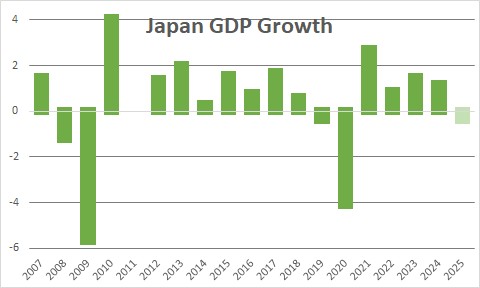
Fourth is Japan. Three months ago the I .M.F. expected growth of 0.8%. Today it anticipates a decline of 0.4%. That is a downward revision of 1.2%.
In all four cases the I.M.F. cut the growth forecast for each of our top four trading partners by 1.2% – 1.5%. U.S. growth was reduced by 0.8%. Tariffs are going to take a toll on everybody, but countries with very open economies will get hit the hardest.
The I.M.F. is well aware of the uncertainty of the tariff situation. Tariffs could be cut. Bilateral deals could be reached. They could be postponed. In fact, the I.M.F. is referring to these projected growth rates as a “reference forecast” based on the information that was available on April 4.
Like many economists around the globe the I.M.F. believes that downside risks dominate the outlook. They talked about possible ratcheting up the trade war, even more elevated trade policy uncertainty, deteriorating sentiment, sharp adjustments in exchange rates and capital flows, broader financial instability, demographic shifts and a shrinking labor force, lingering effects of the recent cost of living crisis, and social unrest. That is a long laundry list and, while we acknowledge the factors it cited, we believe their impact could just as easily be diminished in the months ahead if there is de-escalation from current tariff rates and numerous countries reach bilateral trade agreements with the United States.
Just this week Trump reached a trade deal with the U.K. with a baseline tariff on British goods of 10%. Other countries may follow that template. Trump’s hope is that his turbulent approach to trade may rebalance the global economy on his terms.
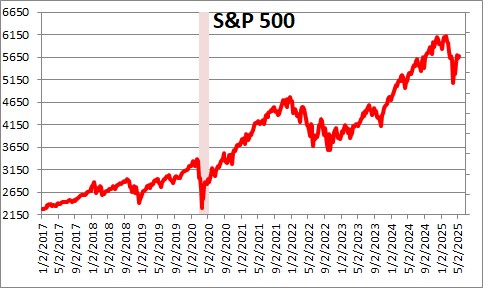
The stock market is convinced that the trade situation is improving. After declining 20% from its record high level on February 19 to April 8 ( one month ago), the S&P 500 index has rallied vigorously and is now down just 7.5% from its peak.
Stephen Slifer
NumberNomics
Charleston, S.C.
As Arthur Laffer, Milton Friedman, and others before them taught us: If you tax something, you get less of it.