April 4, 2024
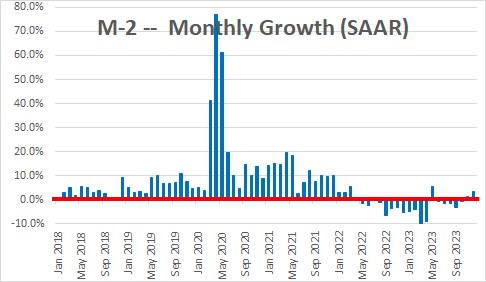
M-2 consists of funds that businesses can use to pay their workers, pay the rent, and keep the lights on, or that consumer can use to pay their rent or mortgage, their car loan, or buy food. Thus, it is a measure of liquidity in the economy.
In March and April of 2020 the Federal Reserve purchased $3.0 trillion of purchases of U.S. Treasury securities and flooded the banking system with reserves in an effort to lift the economy out of the deepest recession in our history In those two months M-2 grew at annualized monthly growth rates of 42% and 77% respectively. The Fed kept purchasing securities through March 2022 which caused the money supply to continue growing rapidly. Since that time the Fed has been shrinking its balance sheet which has caused the money supply to decline steadily.
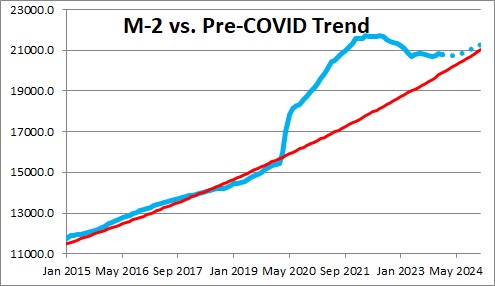
It is important to understand that M-2 typically grows at about a 6.0% pace month after month. The chart below shows how the level of M-2 rose far above its normal 6.0% trendline. Even after declining in recent months it is currently $0.8 trillion above its normal growth path. Thus, there is still $0.8 trillion of surplus liquidity slopping around in the banking system which can fuel consumer and business spending for months to come. If the Fed continues to shrink its balance sheet for the next several months the remaining surplus liquidity should be eliminated by midyear and the economy will presumably have the right amount of liquidity. That should pave the way for a further slowdown in inflation rate in the months ahead.
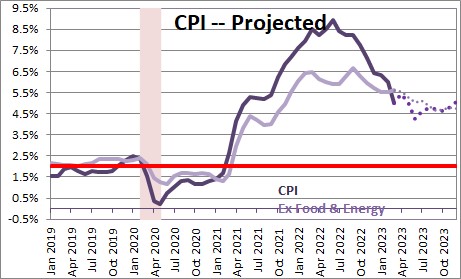
In the past year the CPI has increased 3.2%. The core CPI has risen 3.8%. This core rate of inflation may slow somewhat in the months ahead as that surplus liquidity is eliminated. We expect it to increase 3.4% in 2024 and 2.5% in 2025 . A return to a 2.0% inflation rate is not expected until 2026.
Stephen Slifer
NumberNomics
Charleston, SC
Follow Me