October 10, 2024
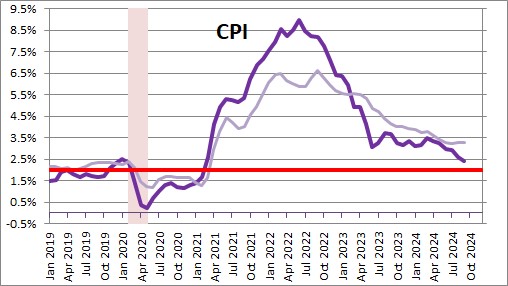
The CPI rose 0.2% in September which is the third consecutive month with a 0.2% increase. The year-over-year increase is currently 2.4%. We now expect the CPI to increase 2.6% in 2024.
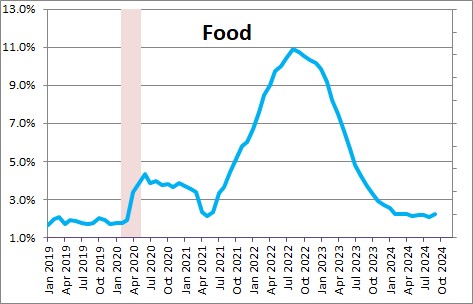
Food prices rose 0.4% in September after climbing 0.1% in August. In the past year food prices have risen 2.2%. Economists typically subtract food and energy prices from the CPI and focus on the so-called “core” rate of inflation. That is because these two categories are extremely volatile. They might go up for a few months but then reverse direction and decline almost as quickly as they rose.
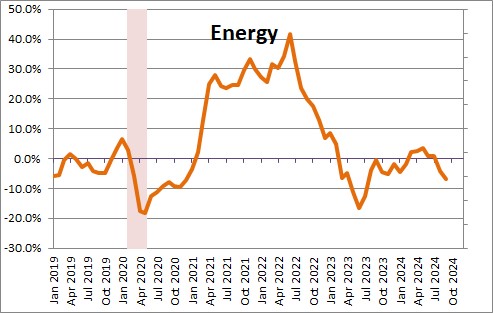
Energy prices dropped 1.9% in September after declining 0.8% in August. In the past year they have declined 4.0%. Next month we should see a sizeable gain in energy prices as the result of heightened tensions in the Mideast.
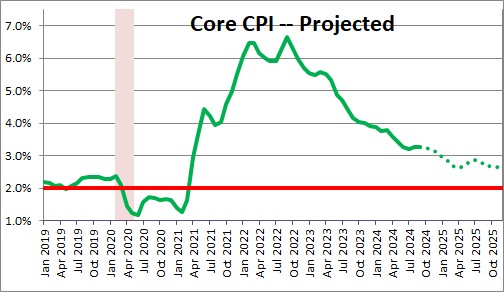
The core CPI rose 0.3% in both August and September after climbing 0.2% in July. The year-over-year increase now stands at 3.3%. The core CPI is decelerating slowly but steadily. For the year as a whole we expect the core CPI to increase 3.1% but then slow in 2025 to 2.6%.
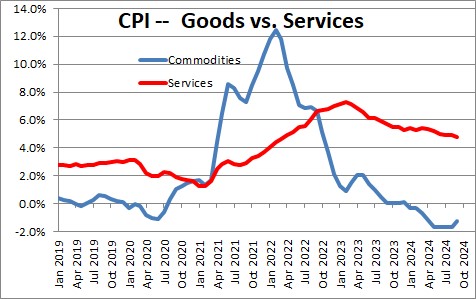
At the moment, goods sector inflation is declining slowly as consumers have been spending less money on goods but more on services. Core goods sector inflation has declined 1.2% in the past year as supply constraints have disappeared. However, inflation in the core service sector (which is twice the size of the goods sector) has been steadily rising and has climbed 4.7% in the past year. This is important because services make up two-thirds of the entire CPI.
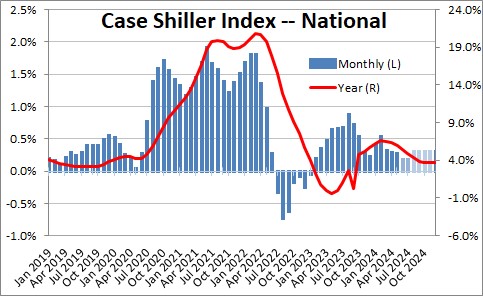
Prices in the service sector are to a large extent being driven by housing. Home prices have risen every month since January 2023 but the rate of increase seems to be slowing.
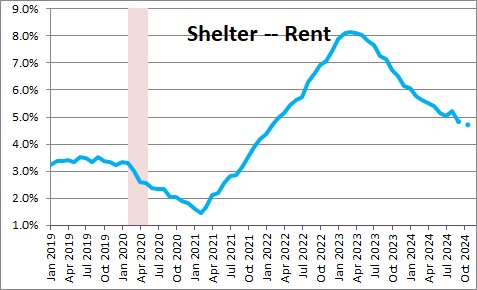
The shelter component of the CPI rose 0.2% in September after climbing 0.5% in August and 0.4% in July. The year-over-year increase now stands at 4.8%. This is a big deal because rents represent one-third of the entire CPI index. A 4.8% increase in one-third of the entire CPI index is not at all consistent with an overall inflation rate of 2.0%. .However, we expect the shelter component to continue to slow gradually between now and yearend.
. 
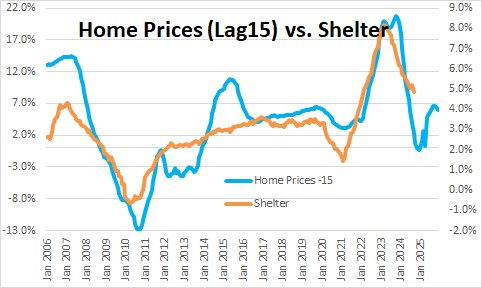
This is because there is a good correlation between the shelter component of the CPI and what happens to the Case Shiller index of home prices with a lag of about 15 months. This means that the shelter component should slow as the year progresses which is one reason that the core inflation rate should continue to shrink in the months ahead.
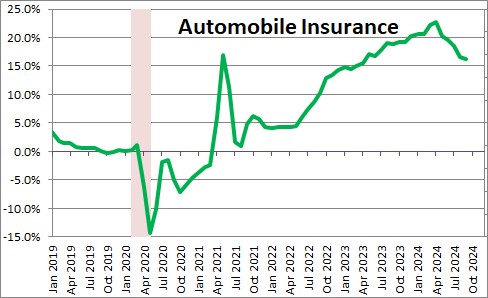
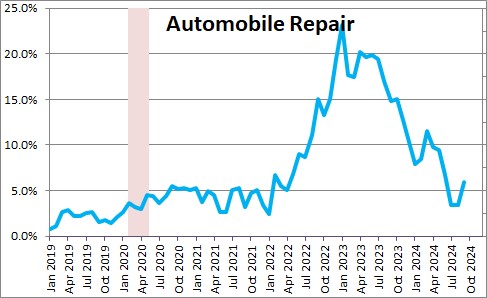
The two of the worst performing service sector components in recent months have been automobile insurance and auto repairs which in the past year have risen 16.3% and 6.0%, respectively. With respect to the automobile insurance category, higher car prices, rising car repair costs (largely labor), an increase in disaster-related claims, and theft and vandalism in high crime areas of big cities are the primary factors behind the gain.
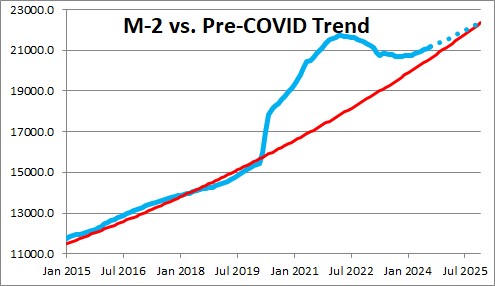
The inflation rate surged in 2020 and 2021 because of the dramatic growth in the money supply. Typically, M-2 rises at about a 6.0% pace. But when the Fed purchased $4.0 trillion of government securities back in the spring of 2020, money growth soared. It continued to grow rapidly right up through March of 2022. Since then the Fed has been shrinking its portfolio and that has caused the money supply to decline. Currently, the level of M-2 stands $0.6 trillion higher than its desired 6.0% growth path. That means that the economy currently has $0.6 trillion more liquidity than it needs. If the Fed continues to shrink its portfolio the excess liquidity should be nearly eliminated by yearend.
We expect the core CPI to increase 3.1% in 2024. It will take another two years for the core CPI to come close to the Fed’s 2.0% inflation target.
Stephen Slifer
NumberNomics
Charleston, SC
Given the stability of these numbers, what accounts for the rapid decline in the 30 year treasury rates during the past two weeks?
Hi Frank.Thanks for your note. It appears to me that the stock and bond markets have become such strong believes that a recession is coming that they are seeking the safety of 10- and 30-year Treasury securities. And now they seem to have support from the Fed when Chair Powell talks about the potential for economic weakness ahead. The question is whether they are right. I think the economy is doing just fine and that in the months ahead inflation will works its way gradually higher. If that is the case, bond yields will begin to rise again. See the piece that I wrote this past Friday which talks about the upward revision to unit labor costs which, to me, suggests that higher inflation is ahead. Thanks for writing.
Steve
Stephen –
Per our exchange of emails a couple of weeks ago about the Federal Reserve, the following quote from the head of the Philadelphia Federal Reserve today (WSJ 1/15/20) indicates the Fed has added about $300 billion to the repo/short term market in the last 3-4 months, so somewhere between $75-100 billion net per month that is not in the revolving repo market. This would seem to be the equivalent of QE in the past, rather than just adding to the overnight borrowing pool, and therefore likely has a major positive impact on equities and other asset prices. Any thoughts on where this is going or why it’s necessary?
Frank
“These interventions have taken the Fed’s balance sheet from around $3.8 trillion in September to $4.1 trillion now. The Fed also has about $211 billion in repos outstanding as of last week, the last time the Fed provided data on its holdings.
The Fed’s interventions “clearly worked, with the effective fed-funds rate maintaining a virtually constant level since October, and repo markets staying calm. Instead of wreaking havoc, the year’s end was a nonevent,” Mr. Harker said.”
Steve –
Can you outline how the official inflation rate is calculated? It seems anomalous that so many essential areas – housing, oil and gasoline, automobiles, technology, food, commodities – are rising, yet the overall inflation rate seems quiescent.
Hi Frank,
Your question is not an easy one to answer for several reasons.
First, there are several measures of inflation. The most widely known is the consumer price index or CPI. It measures the month-to-month changes in a fixed basket of goods that consumers typically purchase each month. Here is a link to the latest report. If you go to table 1, the weights attached to each item are shown in the first column on the left.
https://www.bls.gov/news.release/pdf/cpi.pdf
Second, what the Fed targets is something called the personal consumption expenditures deflator (excluding the volatile food and energy components). It is referred to as the PCE and it differs from the CPI in that the weights for each item can change from month-to-month. Perhaps you remember the old butter/margarine example which is in most basic economics texts. If consumers choose to switch from a high-priced good like butter to a lower-cost good like margarine, even though the actual prices do not change, the PCE will register a decline because it is giving a bigger weight to the low cost good. A more modern example might be a plumber that switches from copper pipe to PVC pipe. For this reason the PCE tends to increase about 0.2-0.3% less per year than the CPI. For example, the yearly increase in the core CPI in 2020 was 1.6%. The yearly increase in the PCE deflator was 1.4%.
So why is inflation so low given all the sizeable price gains in the items you mentioned? It is easy to forget that the CPI includes lots of items whose price has fallen sharply in the past year either because of the recession or because of technology. As you look down the list of items in the CPI note airfares -21.3%, hotels -13.3%, admission to sporting events -21.4%, mass transit -10.1%, apparel -2.5%, footwear -2.1%, TV’s – 2.9%, audio equipment -1.6%. Then there is energy commodities (like gasoline and fuel oil) -8.7%. You get the idea. Lots of things have actually been falling in price.
Regardless of what measure you choose, they all show roughly the same thing — inflation of about 1.5%.
But I do expect inflation to pick up going forward in part because many of the items in that list like airfares, hotels, gasoline, were hit hard by the recession. They have bounced part of the way back, but will climb much more rapidly once the vaccines become more widely available.
Finally, when you look at sky-rocketing home prices, remember that they are not included in the CPI. They are an investment item, not part of our monthly consumption spending. Instead, the BLS uses a measure of rent which have not been rising rapidly — or at least not yet.
When looking at inflation it is important to look at the whole picture and the reality is that many prices have been falling — not rising. But stay tuned.
Best.
Steve
Steve –
Your last write-up on GDP envisioned an 8% increase in the 3rd quarter,
but I understand the Atlanta Fed just put forth their prediction for GDP
in the 3rd quarter to fall dramatically compared to the 2nd quarter. In
addition most of the federal supplemental programs will end sometime
in September, causing a dramatic loss of overall transfer payments. Have
you considered these factors?
Hi Frank,
I know my 8.0% GDP estimate for Q3 is above others. The Atlanta Fed is at 3.7%. But other respected economists are in the 5-6% range. Any of those forecasts could be close. Right now we are in mid-September. Q3 GDP is not released until the end of October so lots of data are still missing. We now have personal income and retail sales data through July. We will get another month of data for both. We will get the employment report for September in early October. The outlook will change as we get each of those tidbits of data and the range of forecasts will narrow.
You seem to focus on government transfer payments. Yes, we will lose federal unemployment benefits. But transfer payments in total have gone from $3.3 trillion in February 2019 (pre-pandemic and recession) to a high of $6.6 trillion in April 2020, but are already back down to $4.2 trillion. And they will never drop back to the $3.3 trillion level where they were prior to the recession. So my point is that transfer payments may drop some in September but they do not have too much further to decline. More important is wages which total $12.5 trillion compared to $4.2 trillion of transfer payments. What happens to wages is far more important than what happens to transfer payments because it is 3X as large. If we get a good sized increase in employment for September coupled with a further decent sized increase in earnings, the increase in compensation could offset or more than offset any drop in transfer payments.
Don’t forget that consumer have $0.5 trillion of surplus savings that they could choose to spend to supplement their consumption spending.
Could GDP increase by less than the 8.0% I am expecting? Of course. As noted, we still have a lot of missing pieces.
But suppose for a moment that we get a 3.7% increase in GDP in Q3. Why did that happen? My sense is that it will have been caused largely by a drop in supply more so than any decline in demand. Look at the automobile industry. The auto manufacturers are stopping production because they cannot get enough parts. Builders are dealing with supply issues and an inability to hire enough workers. Hence, they cannot build enough houses or apartment units to satisfy demand. Firms of all sorts are having to deplete their inventories to fill some of the orders that are coming in the front door. At some point those inventory levels will have to be replaced. That will require a significant increase in production.
We have a record level of job openings that are not getting filled. My guess would be that many of those people who just lost their federal unemployment benefits will — willingly or unwillingly — be forced to get a job. And there are plenty of jobs just waiting for them.
Supply constraints may pull down GDP growth in the current quarter, but eventually they will be resolved and once that happens we will get a sharp rebound in growth. Those supply difficulties may shift growth from one quarter to another, but they do not change the overall GDP outlook.
Steve
Steve –
Thanks for the detailed explanation.