July 1, 2022
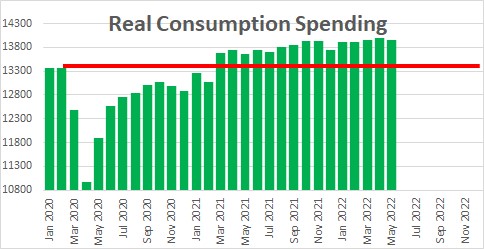
Typically the final look at any quarter’s GDP is a non-event. And at first blush the recent revision to first quarter GDP from -1.5% to -1.6% appears to be a yawner. But upon closer inspection one finds that consumer spending— which is 70% of GDP – was revised downwards sharply for the quarter. The following day we learned that consumer spending was lowered for every single month since January. And given that real consumer spending rose only slightly in April and declined in May, consumption expenditures in the second quarter will be roughly unchanged. That is a lot slower pace of spending than had been anticipated. As a result, we have lowered our second quarter GDP estimate from 2.0% to 0.5%. We do not think the economy is currently in a recession, but it is obviously a lot closer than we thought a couple of weeks ago.
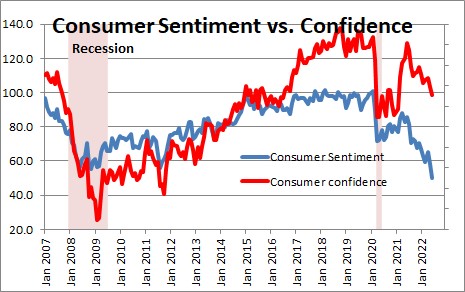
Consumer confidence measures have been declining rapidly since the beginning of the year. But up until now personal consumption expenditures were climbing at a solid 3.1% pace. It appeared that the consumer was largely shrugging off higher inflation, higher interest rates, and the possibility of recession. Now, three months after the first quarter ended, we learn that consumer spending rose far more slowly — 1.8% not 3.1%. Consumers have, in fact, taken note of those negative factors and have been pulling in their horns for the past six months. Now you tell us!
The monthly data on spending now show that spending has been essentially unchanged since January, and will show virtually no growth in the second quarter. With little growth in 70% of the economy it is hard to calculate anything other than an anemic-looking GDP growth rate for the second quarter. We currently look for second quarter GDP to rise 0.5% following its 1.6% decline in the first quarter, and we certainly cannot rule out the possibility of a second consecutive GDP decline which would fit the technical definition of a recession.
While a slower pace of consumer spending has reduced the outlook for second quarter growth, inventories and trade are likely to prevent a second consecutive GDP drop. In addition to a much slower pace of consumer spending, the revised GDP data for the first quarter also showed a much bigger increase in inventories. Presumably as consumers slowed their pace of spending retailers got stuck with far more inventories than they wanted. Inventories will probably climb more quickly than expected in the second quarter as well since spending has slowed while production has not.
At the same time, the trade deficit narrowed significantly in April and May. You will recall that the trade gap widened dramatically in the first quarter and trade subtracted a whopping 3.2% from GDP growth in that quarter. That was the piece that surprised economists in their estimates of first quarter GDP growth. Rather than seeing a moderate increase in GDP in that quarter, the trade component caused GDP to fall by 1.6%. Now we learn that the trade deficit has narrowed sharply in both April and May. We could be setting ourselves up for an opposite surprise in the second quarter. We expect the trade component to add 0.8% to GDP growth in that quarter but this piece is hard to peg. Everybody missed it completely in the first quarter and they could miss it just as badly – but in the opposite direction – in the second quarter. Our first look at second quarter GDP will be released on Thursday morning July 28. There is a lot of uncertainty regarding this number but we expect a small, positive GDP growth rate of perhaps 0.5%.
Clearly soaring inflation is the primary cause of the current economic difficulty. The Fed says it will do whatever is necessary to bring inflation back to the 2.0% mark which implies a much higher funds rate between now and the end of the year. The combo of higher inflation and interest rates has caused a 20% drop in stock prices and made consumers nervous. The recent data suggest that a recession is a lot closer than we had thought.
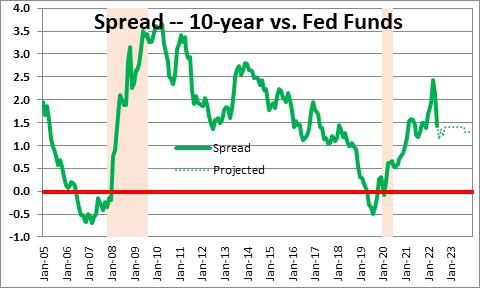
But before we go too far down the recession road, not everything adds up to a nice, neat picture. Start with the yield curve. It always inverts about a year prior to the onset of recession. It has not done that. When people talk about “the yield curve” they often talk about different measures. We use the difference between the yield on the 10-year note less the fed funds rate. (The Conference Board in its calculation of the index of leading indicators uses the same thing.) Today that difference is 1.3% (2.9% -1.6%). Others prefer the difference between the yield on the 10-year note and the 2-year. That difference today is 0.1% (2.9% – 2.8%). Until the yield curve inverts, recession seems unlikely.
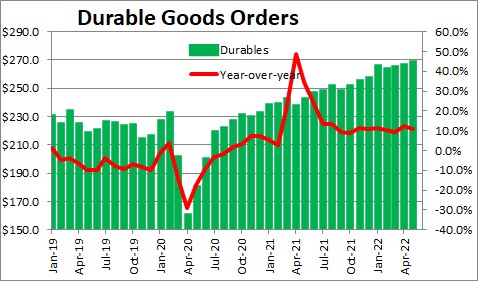
Typically, when a recession nears factory orders begin to fall which eventually results in a decline in industrial production. However, industrial production and durable goods orders have been rising steadily. Having said that, the orders component of the purchasing managers index for June suggests that orders growth is now slowing.
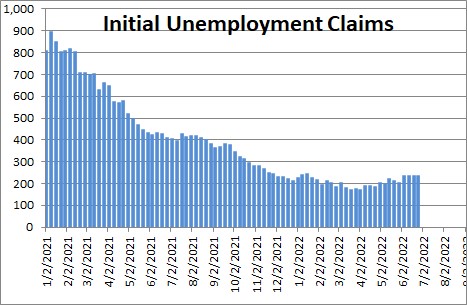
Recessions are characterized by falling employment foreshadowed by an increase in initial unemployment claims (layoffs). In the past three months employment has risen by 408 thousand per month. We expect to see an increase of 350 thousand in June. That figure will be released next Friday. Initial unemployment claims have edged upwards in the past couple of months, but the starting point was a level of claims last seen in 1968. The labor market appears to have weakened slightly, but it is a long ways from registering a decline in employment.
Without a doubt the economy is weaker today than it looked a month ago or even a week ago. The economy is adjusting to the combo of higher inflation and higher interest rates. We still feel that a recession is coming, but that it remains a ways down the road. In our opinion it will require substantially higher interest rates, a positive real funds rate, and an inverted yield curve to make that happen. However, the recent downward revisions to GDP growth and consumer spending make us nervous that a recession could happen sooner than we think.
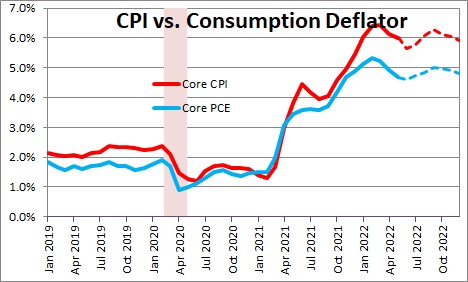
The other piece of the equation that will help determine the future path of interest rates is the inflation rate. In the past year the core CPI has risen 6.0%. But the Fed targets the core personal consumption expenditures deflator. In the past 12 months this inflation indicator has risen 4.7%. Why the difference? The CPI measures price changes in a relatively small basket of goods and services that the consumer buys each month. The personal consumption expenditures deflator is a much broader measure and, most importantly, it takes into consideration changes in the composition of consumer spending. Remember the old butter vs. margarine comparison from your Econ 101 textbook? If the price of both butter and margarine are unchanged in any given month, the CPI will register no change. But if consumers get nervous and switch from buying expensive butter to cheaper margarine, a weighted measure of inflation like the PCE deflator will register a decline even though the prices of both goods are unchanged. Typically the PCE deflator will increase about 0.2% slower than the CPI. Given that today the CPI has risen 6.0% and the PCE deflator has risen 4.7%, the 1.3% difference is extremely wide by historical standards and indicates clearly the extent to which consumers are substituting cheaper products for more expensive ones. While prices may be rising faster than the Fed would like, the slower rate of increase in the core PCE deflator will make their job easier. For now the Fed still seems on track for lifting the funds rate from 1.6% currently to 3.4% or so by yearend. As always, we will see.
Stephen Slifer
NumberNomics
Charleston, S.C.
Follow Me