June 7, 2024
The employment report is the first solid piece of data released for any given month. Because it not only provides information on employment but also on hours worked and earnings for the economy as a whole as well as a wide range of different sectors, it can occasionally signal a meaningful change in the direction or the speed of economic activity. That was not the case for May. Payroll employment rose a solid 272 thousand which was far larger than the 150 thousand increase that had been anticipated. But at the same time the unemployment rose 0.1% to 4.0% in large part because civilian employment declined 408 thousand in May. So which was it? An increase of 272 thousand in employment? Or a decline of 408 thousand? Over time the two series tend to have similar trends. but on a monthly basis there is simply a lot of statistical noise between them. The difference of 680 thousand in May clearly represents a lot of noise! Our sense is that the labor market is gradually slowing down.
Monthly gains in “payroll employment” have been surprisingly steady and have averaged 250 thousand per month since the beginning of the year. Presumably, those robust monthly job gains are being boosted by immigrants flowing into the U.S. from Mexico and – legally or illegally — getting jobs here. The very fact that the monthly job gains have been so steady gives them credibility. These jobs are reported monthly by a broad sample of firms across all industries. Because businesses have no incentive to lie about the size of their payroll, they are generally deemed to be the better barometer of changes in employment for any given month.
But a separate measure of employment is the so-called “civilian employment” gauge which is used to calculate the unemployment rate. In the first five months of the year the monthly changes in civilian employment have ranged from an increase of 498 thousand in March to a decline of 408 thousand in May with an average monthly decline in that period of time of 20 thousand. The problem is that this series is collected by government survey takers knocking on doors and asking questions about whether the individual answering the door has a job. One can imagine that in a sketchy neighborhood the survey taker may not be getting truthful responses. For that reason in any given month changes in the labor force, civilian employment, unemployment, and the unemployment rate can be distorted. Several months of data are required to determine whether changes in these indicators have any significance. It could easily be that the 408 thousand decline in civilian employment in May and the 0.1% increase in the unemployment rate to 4.0%, are followed by a gain of 500 thousand or more in June with a drop in the unemployment rate of 0.1% to the 3.9% mark.
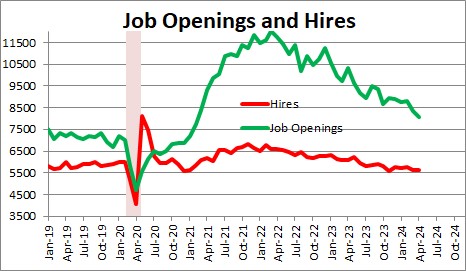
Given this divergence between the payroll employment and civilian employment data, economists look elsewhere for hints regarding the health of the labor market. The data on job openings seem helpful. Job openings have slowed steadily from a peak of 12.0 million per month in March 2022 to 8.1 million in April. The extreme labor shortage that existed a couple of years ago has disappeared. However, prior to the recession there were roughly 7.0 million job openings per month. So while job openings have slowed considerably, they remain solid.
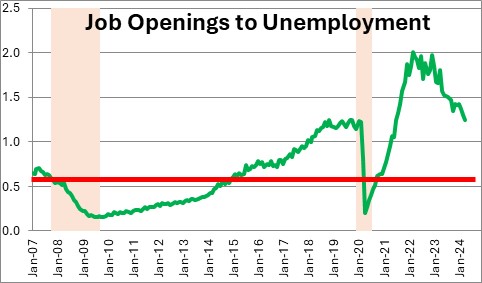
Another way of looking at the same data on job openings is by looking at the number of jobs available for every unemployed worker. In early 2022 there were 2.0 job openings for every unemployed worker. Today that number has dropped to 1.2. But in the past 17 years this ratio has averaged 0.6. Hence, there are typically more unemployed workers than there are jobs available – not the other way around. This means that the demand for labor continues to exceed the supply, but the extreme shortage of workers that existed a couple of years ago has abated. The labor market is weaker than it used to be, but it is hardly weak.
The conclusion from all this is that the economy may be slowing somewhat. Hence, we anticipate 2.7% GDP growth in the current quarter followed by 2.0% GDP growth in the second half of the year – slower, but hardly slow.
With this modest slowdown in the pace of economic activity we are hopeful that the inflation measures will continue to subside slowly. If that is the case the Fed may be able to begin its long-anticipated easing process by yearend, but the pace of easing will almost certainly be relatively slow.
Stephen Slifer
NumberNomics
Charleston, S.C.
Follow Me