July 26 2024
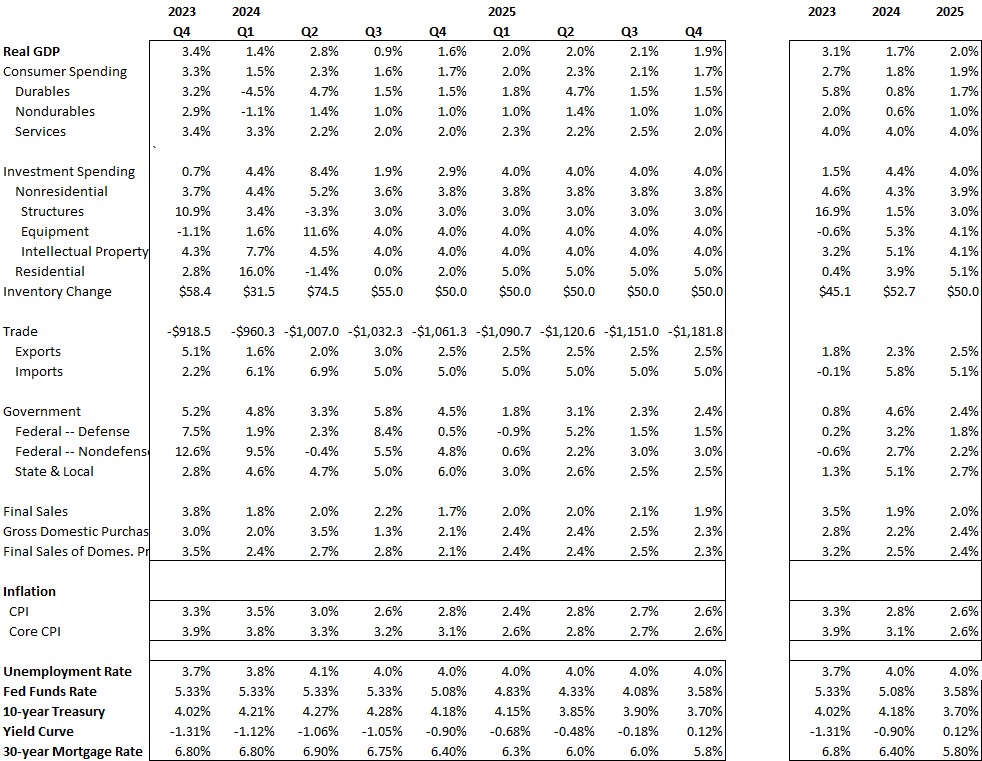
The economy seems to slowing just a bit. The economy continues to create jobs and wages keep growing and consumers continue to spend GDP growth was 2.8% the second quarter and should be followed by 0.6% growth in the third quarter and 1.6% growth in Q4.
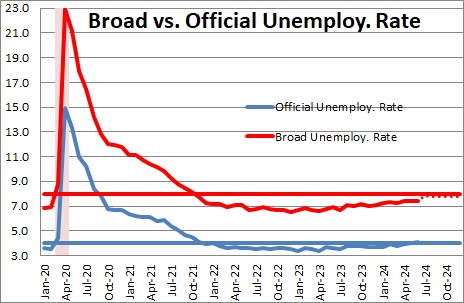
Given the GDP forecast above, we expect the unemployment rate to remain at aout 4.0% for the foreseeable future. With monthly increases in both the labor force and payroll employment homing in on about 160 thousand, the unemployment rate should stay quite steady throughout 2024 and 2025.
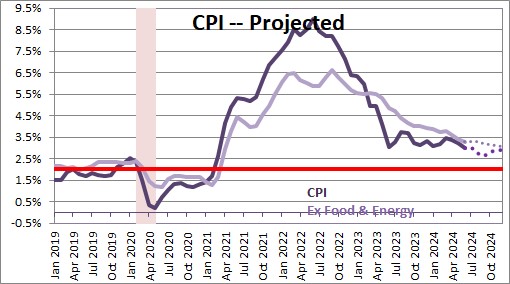
The core CPI inflation rate was 3.9% in 2023. But as surplus liquidity in the economy disappears, we expect the core CPI to slide to 3.1% by the end of this year and then keep sliding to 2.6% in 2025.
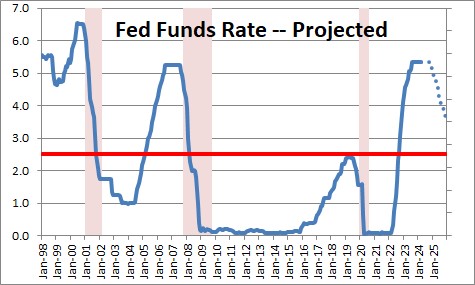
We expect the funds rate to drop from 5.5% currently to 5.25% by the end of this year, and then to continue its descent to 3.5% by the end of 2025.
Stephen Slifer
NumberNomics
Charleston, SC
Steve –
How tight will be the linkage between transient inflation in the second quarter
to 5.3% and the 30 year Treasury rate?
Hi Frank,
I was trying to figure out what you meant by transient inflation in the second quarter of 5.3%. But then I went to the forecast table and there it was! Your eagle eyes picked up something that didn’t look right and questioned it. It turns out that the correct number is 3.6%. I just updated the table so it is now correct. Thanks for catching it!
I think for bond yields to move higher we probably need some sign that GDP growth is going to be a lot stronger than people believe at the moment, or that the actual CPI data in the months ahead show more upward pressure than they anticipate. Right now those inflation expectations for the next 10-years (measured as the difference between the nominal yield on the 10-year and its inflation-adjusted equivalent) is 2.3%. If it gets higher than that bond yields will likely climb a bit. By yearend I am looking for them to climb slightly from 1.6% today to 1.8% by yearend. Higher, but still very low historically.
Best.
Steve
Does the trillions of dollars the fed has flooded the economy with have a direct effect on the GDP?
HI Jeffrey.
Thanks for your question. The answer is yes, but it is important to understand the process. When the Fed buys U.S. Treasury securities it buys them from its primary dealers which are generally a bunch of very large banks. Let’s assume they buy $1.0 million of securities. The banks give the Fed the securities. The Fed puts the $1.0 payment for those securities into the bank’s “reserves” account. (Think of a reserves account as that bank’s checking account,) So the proceeds have moved from the Fed to the banking system. But banks presumably want to put that $1.0 million to work so they lend it to you or me or some business. Once that happens you or have get the $1.0 million placed into our checking accounts. At this point, the money supply rises (the M-2 measure basically consists of checking account balances, savings accounts, money funds and the like — all very liquid, spendable funds). But we borrowed from the bank because we wanted to do something with that money — buy a house or a car, purchase new technology to make my firm more productive, etc. Basically, we spend the money. It is at this point that GDP rises. We are buying something and so that lifts the consumer spending or investment spending components of GDP.
The basic answer is yes, but it is not exactly a direct process. In 2008-09 the Fed bought a large volume of securities, but banks were so busy repairing their balance sheets that they funds never got lent out to consumers or businesses. In short, the process got short-circuited and never had the desired effect. This time the funds are being lent out and money supply growth is soaring — 24% in the past year. M-2 typically grows by about 6%. 24% growth is unprecedented which is why, this time, the Fed’s actions are stimulating the economy and why inflation is almost certain to rise.
Best.
Steve Slifer
Thanks for the explanation, Steve.
I’m trying to wrap my brain around how to prepare for what’s coming.
Thanks,
JLP
Steve –
How is the line in your table titled “Yield Curve” calculated?
It doesn’t seem to represent the difference between 10 and 30 year nominal bond
rates, because that is currently only 0.34%, down from 0.8% at the end of
February 2021.
It is the difference between the yield on the 10-year note and the fed funds rate. When talking about the “yield curve” most economists will look at the spread between the 2-year and the 10-year. I use the funds rate because people tend to talk about the funds rate rather than the 2-year, so it seems to be easier for them to understand. The point of looking at the yield curve is because when it inverts (meaning short rates are higher than long rates) it is a pretty good indicator that the Fed has tightened “too much” and that recession will occur within a year or so. If you look back at history either the 10-year/2-year spread or the 10-year/FF will give you essentially the same answer.
Doesn’t simple math tell us that with the unprecedented creation of new currency (i.e. a bunch of 1s and 0s with no hard asset backing) injected into the economy, that inflation MUST be persistent? I don’t understand any scenario where this type of action, never before done in any economy in history, can result in anything but persistent, long-term inflation. If I’m wrong please tell me why.
Hi Chuck,
Thanks for your question. These crypto-currencies are not “money” in the sense that they can be “created”. They are a commodity much like gold or soybean futures. When we buy any of those things we pay for it. Money comes out of our checking account to make the purchase and ends up in somebody else’s account. No money is created. It is just transferred from one owner to another. You might say that there are bitcoin “miners” who create the bitcoins. True. But that is like a farmer growing another crop.
Having said all that I do believe that out-of-control growth in the money supply is the source of the problem. The M-2 measure of money should grow at about a 6.0% pace — roughly in line with nominal GDP growth. When the recession hit and we shut down the economy in March and April 2020, M-2 growth exploded and it has continued to grow rapidly since. The year-over-year increase in M-2 today has slowed but is still 9.9% — far in excess of what is needed. Each month that M-2 grows at a rate in excess of 6.0% the surplus liquidity in the economy continues to climb. Today there is about $4.0 trillion of surplus liquidity floating around in the economy. No wonder we have an inflation problem. Too much money chasing too few goods. I will send a couple of M-2 charts to your e-mail address. It is hard to see how inflation will get back in check any time soon.
Steve Slifer
I read your comments and take them seriously and from them and other observances I try to make some sense of what is to come. What I have not read from you is the effect that oil is having on inflation. Oil or very similar fuels are quite expense lately which raises the cost on all activities which in turn fuel (no pun intended) inflation.
It seems to me inflation is being baked into the cake regardless of the intentions of the Fed.
Good morning Al,
As noted in the article I am hopeful that a continuation of slow (or even negative) growth in the money supply will slow the rate of inflation over time — just as it has boosted it currently. But in the short term you are right that some factors are going to keep inflation elevated for an extended period of time — and you correctly point to energy prices as one factor.
Re: energy, the war is one factor elevating oil prices, but — more importantly in my view — is the reduced production of crude oil by U.S. producers. Prior to the recession they cranked out 13.1 million barrels of oil per day. During the recession it fell to about 10.7 mbpd. It has risen since but today is only 11.9 mbpd or some 10% below its prior peak. Why? Largely because the Biden Administration has declared war on the fossil fuel industry. They veto proposals about new energy pipelines. They impose new environmental regulations that oil companies must adhere to if they want to increase production. Not surprisingly oil production has not yet fully recovered. We need more oil. But we are apparently not going to get it from domestic production.
Food prices are being impacted by the war and by droughts in the crop-growing regions of our country. Ukraine is a big exporter of corn and wheat. Given the war those exports are not going to happen.
The tight labor market is forcing employers to bid up wages to attract the workers they need. Wages have risen 5.5% in the past year. But inflation has risen even faster and real wages have fallen by 2.5%. With real wages falling there is an incentive for workers and union to seek even bigger wage increases going forward. That is not going to stop until interest rates rise enough to slow the pace of economic activity, and the unemployment rate rises from 3.6% currently back above the 4.0% mark.
Home prices have risen 20% in the past year. Rents are also rising. Have risen 5.0% in the past year and seem to be accelerating. No great surprise since the vacancy rate amongst rentals is the lowest since the early 1980’s. That is not going to slow until either interest rates rise enough to slow the economy, or builders step up the pace of production of both single-family homes and rental units appreciably. But to do that they need more bodies, and they need to significantly reduce those supply chain problems.
As a result of slower growth in the money supply I have reduced the projected rate of increase of the core CPI this year to 5.3% and 4.4% next year. Lower than they were before, but still well above the Fed’s 2.0% desired growth rate for inflation.
Steve –
GDP declined in the first quarter by 1.6% and the Atlanta Fed projects in
GDP Now that it will decline 2.1% in the second quarter (though I’m aware
you don’t agree with that at the moment.) Two quarters of decline
define a recession. If the Atlanta Fed is right, then we’re currently entering
a recession – not next year, so things are worse than is generally recognized.
I’m not sure how you reconcile this with the strong employment numbers.
No one seems to be recognizing or talking about this dichotomy- what’s
going on???
Steve, Excellent report for 8/26/22 as always. We have a group of amateur traders and investors and have been debating how quickly inflation may drop. Based on the St. Louis FED data at https://fred.stlouisfed.org/series/M2SL M2 may be leveling out but does not appear to have made a turn downward. I know the basics of how the FED does OMO and the effect of raising interest rates but why does it appear to take so long to reduce liquidity in the market? Will reduced consumer spending be enough to get inflation turned around in the next 6 months? Thanks!
Hi Blake,
The answer is that the growth rate in the money supply in the past year has been 5.3%. In the past six months it has been unchanged. So you are right, that it is leveling off. The problem is that it grew so rapidly in the March, April and May 2020 period (with monthly annualized growth rates of 41%, 76% and 59% that it jumped so high and provided so much liquidity to the market (when it was essentially shut down and the Fed worried about whether it would have enough liquidity to get through that period. I do not know how to send charts through this website so I will send them to your website. Currently, there seems to be about $3.6 trillion of surplus liquidity out there. If the money supply is unchanged in any given month and its trend rate is supposed to rise by 6.0% (which works out to about $90 billion per month) it reduces surplus liquidity by $90 per month. At that rate it will take 3-1.2 years to eliminate the surplus liquidity.
Best.
Steve
Hi Steve, thanks for the great articles. I have always enjoyed reading them. One question, you mentioned about M2 money supply is still rising every month, but what I’m seeing here https://fred.stlouisfed.org/series/M2SL, the M-2 has been declining steadly since last March. Just so I understand your article correctly, maybe I misunderstood something. Thanks.
Hi Dan.
Your question is a good one. What you are seeing in the FRED data is correct. I will send you some pictures to show you what I am talking about. M-2 has slowed sharply since April of last year. In the past year it has declined 1.3%. However, the money supply surged every month from March 2020 through November 2021. It grew every month at a double-digit pace. M-2 should growth at a pace roughly commensurate with nominal GDP or about 6.0%. It grew much faster than that every month from March 2020 through November 212. So each month the level of M-2 got farther and farther above where it was supposed to be. That difference between where it is and where it is supposed to be reflects surplus liquidity in the economy. So, if M-2 declines in one month it wipes out a small portion of that surplus. Today it stands $2.6 trillion above target which means there is still surplus liquidity in the economy. As long as that is the case I believe that we will have a hard time getting inflation to slow dramatically. Check your in box and I will show you the pictures.
Steve
Steve, is your fed funds projection for the third quarter of this year 6%. It appears to read 0% in the table
Hi Bob. You are absolutely right. How in the world did that get in there? Obviously I missed it.
Th correct rate is 5.75% at the end of Q3. 6.0% by the end of the year.
Steve, thanks for your update. And thank you for your continued comments.
Looking forward to your December event.
Bob
Do you really believe the Fed will not try to exert its will more, as opposed to allowing your forecast become reality?
Good question. A couple of “ifs”. If GDP growth slows in Q4 and the first half of next year as I and almost everybody else expects, that will help keep them on the sidelines. And if inflation continues to work its way lower — even though it will remain above target — I think they may choose to wait it out rather than risk overdoing it. The sharp slowdown in M-2 growth seems to be having the desired effect.
Moving the funds rate from 0% to 5.5% was easy. Now they have to think about it a little.