May 29, 2025
.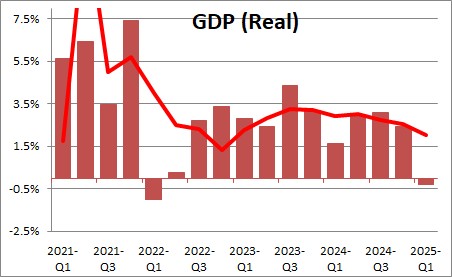
The preliminary estimate of first quarter GDP was -0.2% compared to the advance estimate of -0.3%. That compares to the final estimate of fourth quarter GDP of 2.5%. Growth in the past year has been 2.1%. That first quarter decline was seriously distorted by a dramatic increase in imports caused by businesses trying to get goods into the country prior to the imposition of tariffs. In fact, the trade component subtracted a mind-boggling 4.9% from GDP growth in the first quarter.
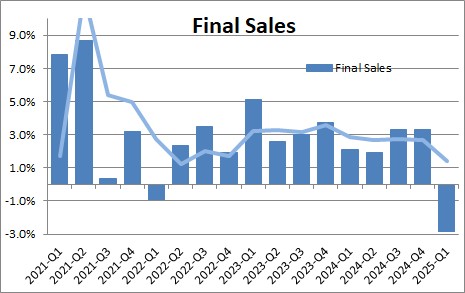
Final sales, which is GDP excluding the change in business inventories, fell 2.9% in the first quarter after having risen 3.3% in the fourth quarter. The estimate of final sales was distorted by a huge increase in inventories. Presumably some of the imports that are intended for future use ended up at least temporarily inventories. Subtracting a big increase in inventories from GDP ended up as a 2.9% decline in final sales. Given a decline in GDP of 0.2% and a 2.9% decline in final sales, the change in inventories added 2.7% to GDP growth in the first quarter..
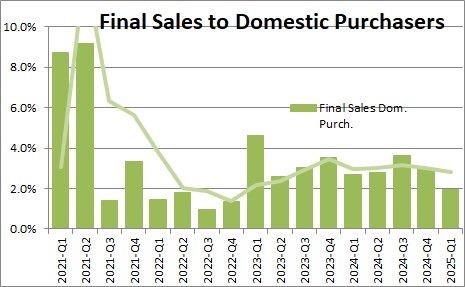
Final sales to domestic purchasers which excludes both the change in inventories and trade rose 2.0% in the first quarter after having risen 3.0% in the fourth quarter. With a 2.9% decline in final sales and a 2.0% increase in final sales to domestic purchasers, the trade component subtracted 4.9% from GDP growth in the first quarter as exports rose 2.4% while imports surged by 42.6%. In our opinion the 2.0% increase in final sales to domestic purchasers most accurately describes the strength of the economy in the first quarter.
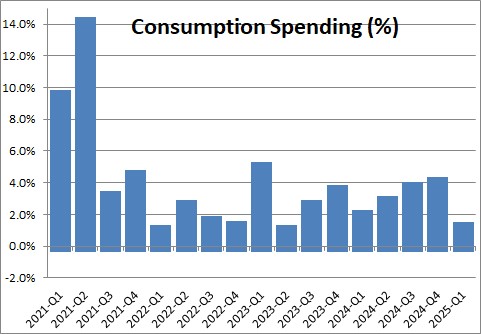
Consumption spending rose 1.2% in the first quarter after having jumped 4.0% in the fourth quarter. While nervous about what might happen to the inflation rate and jobs in response to the imposition of tariffs, consumers continue to shrug off those fears. With real disposable income rising 1.7% in the past year and personal consumption expenditures rising 2.9%, consumers will likely slow their pace of spending somewhat in 2025. We expect them to spend at a 1.8% growth rate in 2025. Spending on goods rose 0.1% in the first quarter while spending on services climbed by 1.7%.
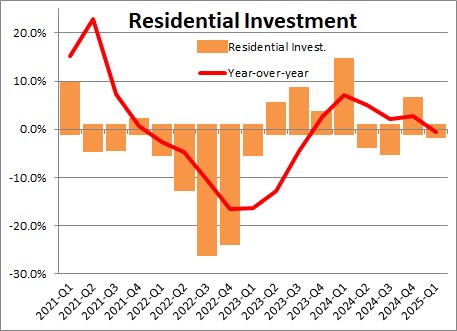
Residential investment declined 0.6% in the first quarter after having gained 5.5% in the fourth quarter. The housing market appears poised for a gradual upturn in 2025. We expect to see 3.4% growth in this category in 2025.
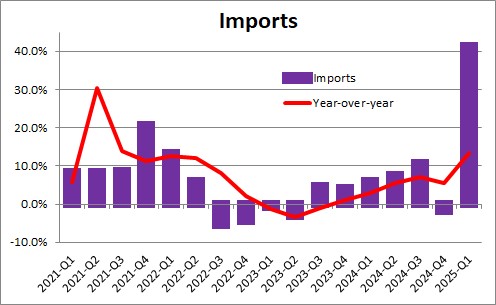
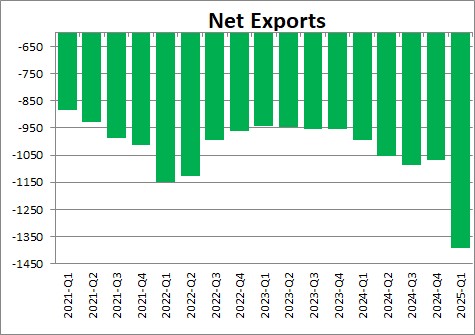
The foreign sector as measured by the deficit for real net exports widened by widened by $326.3 billion in the first quarter to a deficit of $1,379.0 billion, after having narrowed by $16.6 billion in the fourth quarter. Exports rose 2.4% in the first quarter while imports surged by 42.6%. Again, the increase in imports reflects business trying to get goods into the country prior to the imposition of tariffs.
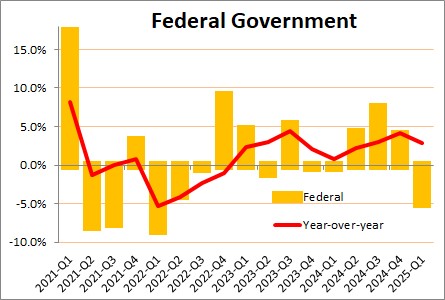
Federal government spending declined declined 4.6% in the first quarter after having risen 4.0% in the fourth quarter. Defense spending fell 7.1% while nondefense spending declined by 1.1%.
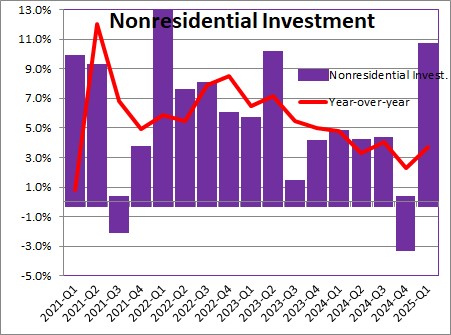
After growing 2.5% in 2024 we expect to see GDP growth of 1.9% in 2025. The economy keeps cranking out jobs and wages keep rising which will allow consumer income and spending to grow rapidly. AI spending should keep nonresidential investment climbing at a respectable pace.
Stephen Slifer
NumberNomics
Charleston, SC
Mr. Slifer –
The fed in last 3 months since the September spike has injected approximately $60 billion/month into the “repo” market, and plans to potentially add as much as another half trillion by mid January, according to reports in the Financial Times. Mr. Powell rejected comparisons of this with earlier Quantitative Easing, insisting it was different. Since the repo market is for overnight or short term loans, one assumes these massive amounts will be repaid promptly, though there has been no mention of that in the papers. Such massive amounts of money would seem to contribute to the bullish equity markets we’re seeing. Can you educate me as to how these injections of credit influence the market, GDP, etc?
Hi Frank,
Thanks for your comment and sorry for the delayed response. Your question is not an easy one to answer so rather than a lengthy explanation here I will respond to your personal e-mail address. Thanks for your question. it is a good one.
Steve
Steve –
The second graph in this section, “Final Sales”, has the x-axis mislabeled in regard
to the applicable dates.
Hi Frank. Merry Christmas. You are right. The data shown are for the dates I wanted, but somehow the x-axis was messed up. I changed it in the original. Thanks for the catch.
Steve