April 6, 2025
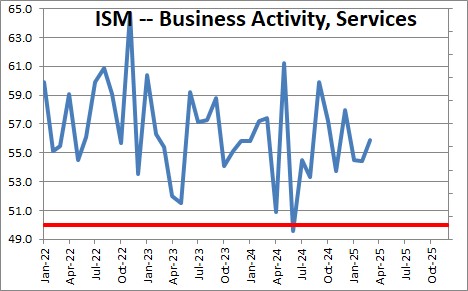
The Institute for Supply Management not only publishes an index of manufacturing activity each month, they publish two days later a survey of service sector firms. The business activity index rose 1.5 points in March after declining 0.1 point in February. We tend to focus on the business activity component as a measure of “production” because it seems to track better with the pace of economic activity. It has been bouncy in recent months but still shows solid growth in the service sector despite Trumps imposition of tariffs, the early stages of federal government layoffs, and deportation of immigrants.
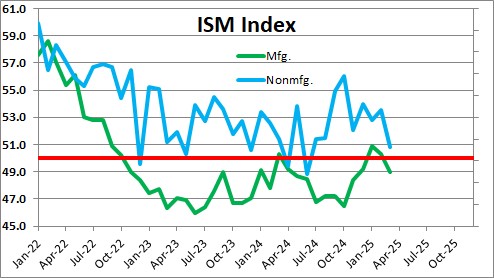
The composite index declined 2.7 points in March to 50.8 after having risen 0.7 point in February. Ten industries reported growth in March, a drop of four from the 14 industries reported in each of the previous two months. According to Steve Miller, Chair of the Institute for Supply Management’s Business Survey Committee, “March saw drops in the readings of three (New Orders, Employment and Supplier Deliveries) of the four subindexes that directly factor into the Services PMI®. Only Business Activity saw an increase over February’s reading. Employment was the only one of these subindexes to drop into contraction territory after three straight months with all four in expansion. There has been a significant increase this month in the number of respondents reporting cost increases due to tariff activity. Despite an increase in comments on tariff impacts and continuing concerns over potential tariffs and declining governmental spending, there was a close balance in near-term sentiment, between panelists with good outlooks and those seeing or expecting declines.”
At its current level the ISM group says that is consistent with 0.7% growth in GDP. We expect to see 1.5% GDP growth in the first quarter and 2.5% GDP growth in 2025.
Comments from respondents include:
- “Restaurant sales and traffic have improved in the past month overall. Valentine’s Day typically starts an improved seasonal trend that was consistent this year. We remain optimistic about the coming months, despite recent news of possible recession and tariffs that have not played out yet.” [Accommodation & Food Services]
- “Starting to see effect of aluminum tariff. These costs will be passed on to customers.” [Construction]
- “Patient volumes continue to exceed forecast, leading to increased revenues and an improved financial outlook. Supply chains continue to operate effectively and few categories — including IV solutions — are showing signs of duress. Labor outlook is improving, with reliance on travel staff continuing to recede. Outlook for the duration of the quarter is favorable.” [Health Care & Social Assistance]
- “The tariffs have caused issues in the groundwood paper market especially. With a large amount of groundwood imported from Canada to the U.S., the tariffs and resulting delays have caused havoc with the supply chain and deliveries. U.S. mills are getting backlogged and late from the additional tonnage they’ve taken on.” [Information]
- “New equipment purchases have slowed down over the last month due to the uncertainty of the new administration and cancellation of certain aspects of the Inflation Reduction Act.” [Other Services]
- “We are seeing some loosening in the U.S. economy related to hiring and people retention. Quality candidates are available, and employee turnover is decreasing. Competitive pressure for goods and services is increasing as suppliers seek organic increases in revenue.” [Professional, Scientific & Technical Services]
- “Government budget cuts and layoffs are negatively impacting our operations.” [Public Administration]
- “We are still holding back some money for emergency use in case the new administration targets grant usage and puts a hold on current spending.” [Transportation & Warehousing]
- “We’re expecting price increases in the near future due to tariffs on several commodity-based contracts, including waterworks items.” [Utilities]
- “Tariff confusion and the variety of ways that suppliers are responding have had a strong effect on our purchasing decisions this month, causing us to shift spend and in some cases buy in advance of reported tariffs.” [Wholesale Trade]
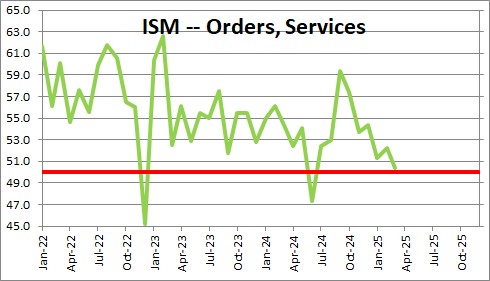
The orders component fell 1.8 points in March to 50.4 after having risen 0.9 point in February. This index has been steadily declining since September of last year. Comments from respondents include: “Increased sales associated with lower mortgage rates” and “New capital projects are on hold.”
.
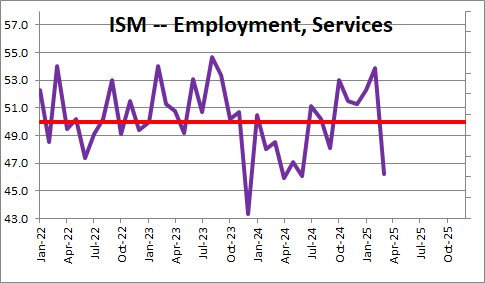
The ISM non-manufacturing index for employment plunged by 7.7 points in March to 46.3 after having risen1.6 points in February. After increasing for five consecutive months, the employment index collapsed in March. Four industries reported an increase in employment in March. Comments from respondents include: “Have been able to hire high-quality employees to fill open positions” and “Conservative view of the job market and economy; not adding head count or resources.”

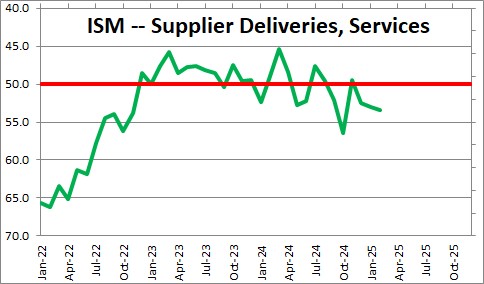
The suppler deliveries component fell 2.8 points to 50.6 in March after having risen 0.4 point in February. This component is reversed in the sense that a reading above 50 percent indicates slower deliveries to service sector firms, while a reading below 50 percent indicates faster deliveries. Thus, firms reported slower delivery times in March for the fourth month in a row. Comments from respondents include: “Capacity in certain transportation modes is allowing for faster/shorter lead times” and “Steel conduit lead times have increased due to factories unable to keep up with demand.”
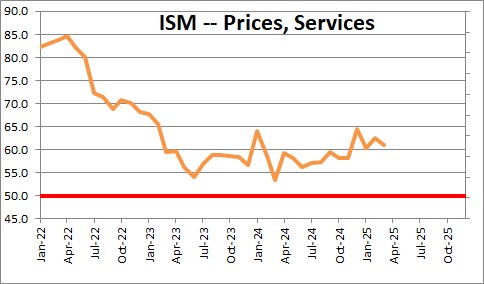
Finally, the price component declined 1.7 points in March to 60.9 after having risen 2.2 points in February. It turns out that the December, January, February, and March readings are the first four months above 60 since March 2023. Fourteen of 18 service sector industries reported an increase in prices paid during the month.
The manufacturing sector of the economy contracted every month from November 2022 until January 2025. After rising in January and February the index has since resumed its decline. The service sector continues to expand at a respectable pace. We anticipate 1.5% GDP growth in the first quarter and 2.5% GDP growth in 2025.
.Stephen Slifer
NumberNomics
Charleston, SC
Steve –
How can the long bond interest rate remain immune to the very broad based
increases in wages, prices, and inflation? What is the specific linkage between prices
and long bond rates? The data you present seems to indicate that significant
inflation into the latter part of 2021 and 2022 is inevitable, and it’s unclear how
transient it will be.
Hi Frank,
Bond yields are influened by expectations about what is going to happen as much as what is actually going on. Powell says the current pickup in inflation is temporary and that by next year it will drop back to 2.0%. Let’s assume he is right. That means that for the next decade the real rate for the 10-year will be -0.7% (1.3% – 2.0%). In the past decade it has averaged +0.5%. In my world if inflation averages 3.7%, that would make the real 10-year average -2.4%. That is not sustainable. Who in their right mind wants to own a bond that yields 1.3% when its purchasing power is declining by 2.4%. Keep in mind, too, that the Fed is purchasing $120 billion of bonds per month. By the end of this year or early in 2022 the Fed will cut back. Seems almost inevitable that once that starts it will push bond yields higher. Then, with each passing month that inflation does not abate, that should contribute to additional upward pressure on bond yields. To me, a 1.3% 10-year rate is unsustainable.
Steve