June 15, 2012
As we approach the midyear mark, it is time to review the economic forecast made at the end of last year, and update the outlook through the early part of next year.
At the end of last year we anticipated GDP growth in 2012 of 3.0%. We also suggested that we would see employment gains average 210 thousand during the course of the year, and the unemployment rate fall to 7.6%. So how are we doing? What’s next?
Four events of importance occurred in the first half of this year.
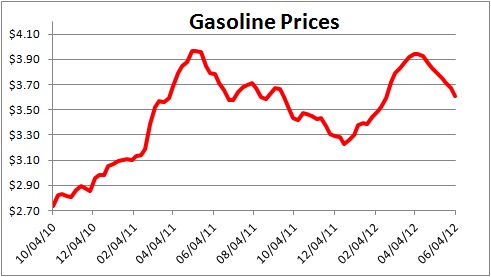
- Oil prices climbed sharply early in the year and appear to have had a mild negative effect on the economy.
- With GDP in Greece expected to shrink by 4.5% in 2012 and the unemployment rate approaching 20%, Greek voters ousted their prime minister in May and rejected the previously agreed upon austerity measures. The fear is that Greece will either choose or be forced to leave the monetary union. This situation has created considerable fear and uncertainty. This weekend’s election is certain to elicit a strong market reaction, one way or the other, on Monday.
- Unseasonably mild winter weather biased upwards many economic statistics during the winter months when economic activity is usually quite subdued. But in the spring the economic data were biased downwards because much of the hiring and home sales had already occurred. While the biases even out over the entire period, markets are currently focused on the recent data which are skewed to the low side.
- The winding down of the war in Iraq sharply curtailed defense spending in the past two quarters. In fact, such cuts trimmed GDP growth in the fourth quarter of last year by 0.7% and in the first quarter of 2012 by another 0.5%. However, the bulk of those spending cuts are now behind us.
While oil prices may have risen early in the year, the good news is that they are now falling rapidly. To whatever extent they held back GDP growth in the first half of the year, they should provide a moderate stimulus to economic activity in the second half. Pump prices thus far have reversed about one-half of their early-2012 increase, but because wholesale prices have fallen much more rapidly retail prices nationally should continue to slide to $3.25.
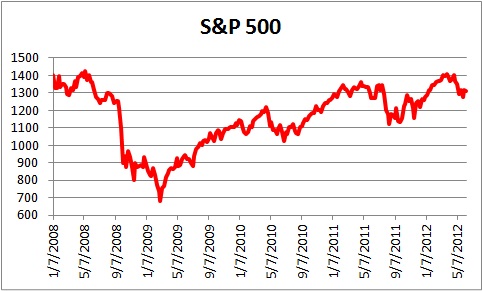
Unfortunately, the situation in Europe remains murky and is likely to remain so for the foreseeable future as concern shifts between Greece, Spain and Italy. The biggest casualty thus far is the stock market which has become very volatile in response to each tidbit of news. While subject to extreme daily fluctuations, the reality is that the cumulative decline is only about 6% which is about one-third the size of the falloff in the spring of last year.
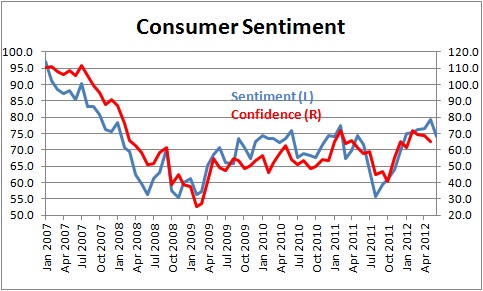
Last year consumers were severely spooked by the stock slump that was caused by the lethal combination of slower pace of economic growth caused by parts shortages following the tsunami in Japan, debt problems in Europe, and the possibility of a default by the U.S. Treasury. Confidence plunged to levels last seen during the course of the recession. That is not the case this time. The consumer’s outlook has not been dampened significantly by these events in Europe. Why not?
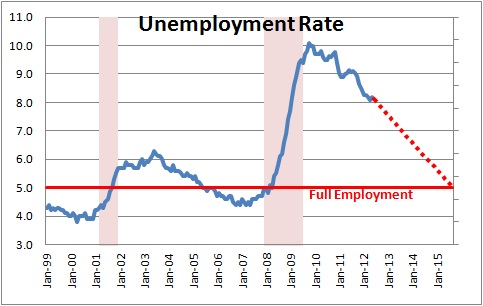
A couple of thoughts come to mind. First, the employment outlook has brightened considerably. The unemployment rate has fallen far more rapidly than most economists had expected. While still high at 8.2%, the reality is that the Fed thought that the unemployment rate would not reach its current level until the end of 2012. It appears to be well ahead of schedule.
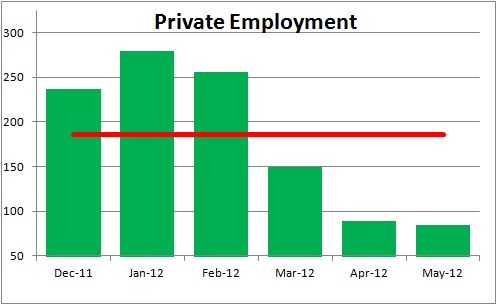
There is some concern that employment gains have slowed in recent months and many fear that this reflects a significantly slower pace of economic activity. We have a more difficult time buying into that scenario for a variety of reasons, one of which is weather-related. During the winter months private sector employment climbed by about 250 thousand a month in part because the very mild winter weather conditions skewed data to upside. In the spring, the monthly gains slumped to about 115 thousand but were biased to the downside presumably because much of the typical spring hiring had already occurred. Going forward employment should rise far more rapidly than recent data suggest, perhaps something in the range of 160-180 thousand per month. The situation in Europe may have slightly dampened corporate hiring decisions, but not nearly as much as recent data suggest.
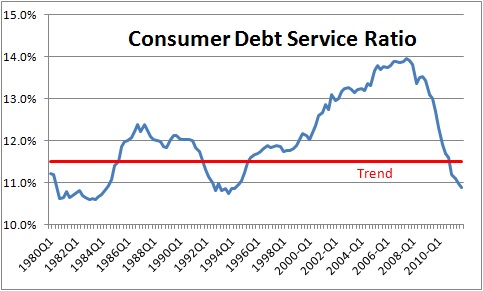
Another reason why the situation in Europe may not be having a significant negative impact on confidence is that U.S consumers now have a far more comfortable financial situation. After years of serious debt reduction their debt burden is the lowest it has been since 1994.
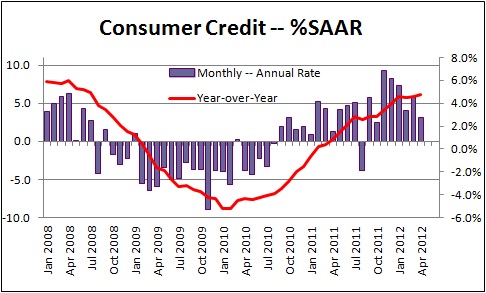
As a result, consumers are once again willing to take on additional debt and credit is readily attainable. Consumer credit began to rise in the latter part of 2010, but gathered momentum late last year. Consumers clearly are not acting as if they are worried about anything.
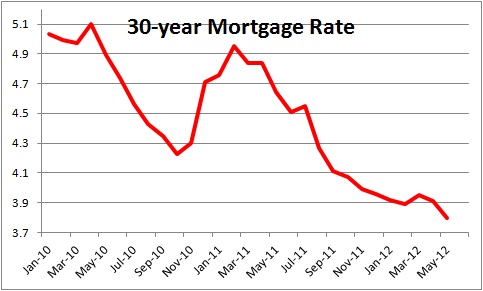
Turning to the housing sector, it is readily apparent that the long-awaited recovery in housing is underway. Conditions have been ripe for a rebound in housing for some time. Mortgage rates are at a record low level of 3.7% thanks in part to the Fed’s “Operation Twist” program where it essentially sells some of its short-dated Treasury securities and buys an equivalent amount of long-dated Treasuries. This twist does not further increase the already bloated level of bank reserves, but it has caused long-term interest rates to fall by about 40 basis points.
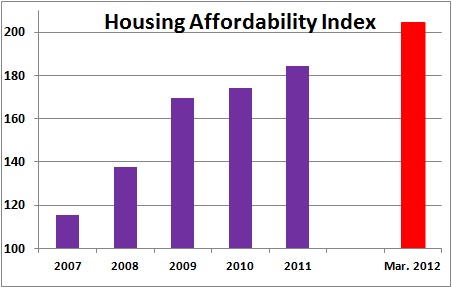
Combining this lower mortgage rate with a roughly 35% drop in home prices means that homes are more affordable today than they have been at any time in the past 40 years. Clearly, the seeds are being sown for a housing market recovery.
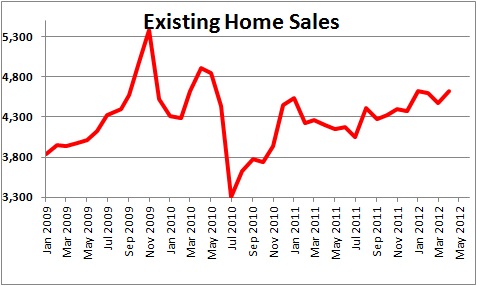
These ripe housing market conditions are finally beginning to bear fruit. Existing home sales have climbed by almost 50% from their absolute low point in July 2010, and about 15% in the past year.
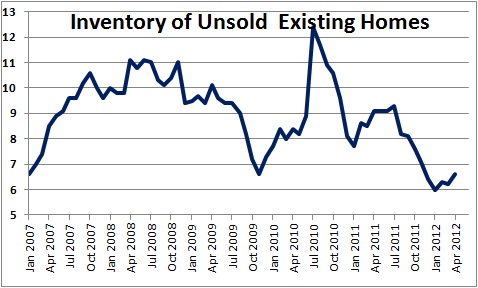
As home sales have quickened the unsold inventory has fallen sharply to a very comfortable 6 month supply. Indeed, the National Association of realtors indicates that there are actual shortages of available homes in some sectors of the country.
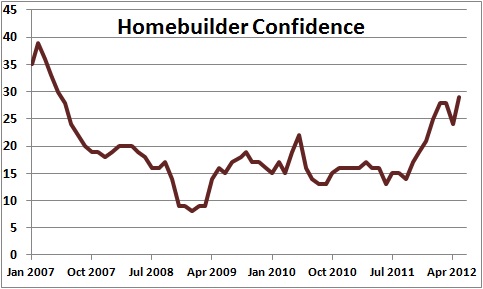
This very low inventory of available homes has caught the attention of builders along with a sharp increase in traffic through the model homes. As a result, builders are now more confident than they have been at any time in the past five years.
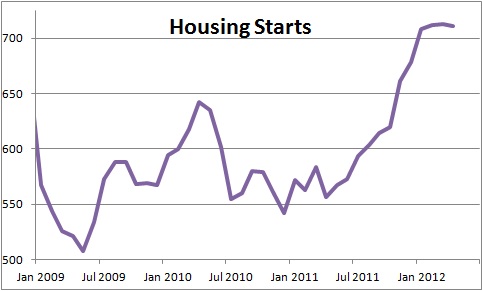
Not only are builders feeling good, they are doing something about it. Housing starts have increased by about one third from where they were at the end of 2010. While both single-family and multi-family dwellings have contributed to the gain, the multi-family sector has accounted for the lion’s share. With many former home owners swelling the ranks of renters, rental rates have surged. Not surprisingly builders have really stepped up the pace of apartment construction. It is important to recognize that this process is still in its infancy. Home sales need to climb to 1.3 million or so just to keep pace with population growth. Given that they are currently at 725 thousand the housing sector can easily double over the course of the next two or three years.
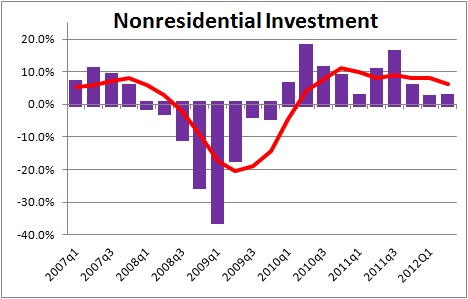
What about investment spending? How are businesses reacting to this uncertainly from Europe? It is clear that investment spending slowed in the first half of 2012. In the first couple of years of expansion firms invested in technology and nonresidential investment expanded steadily at about a 10.0% pace. But in the first half of this year the pace of spending slowed to about 4.0%. Our expectation is that such spending will re-accelerate to about 8.0% in the second half of this year. Why?
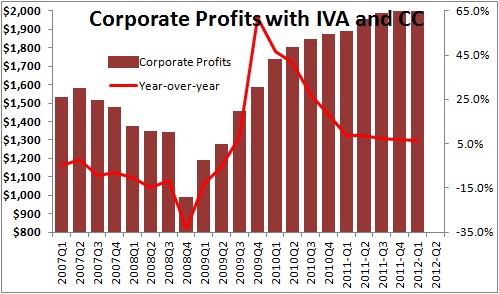
First of all, corporate profits remain at a record high level. While the rate of growth has slowed it is still growing at a healthy 6.0% pace.
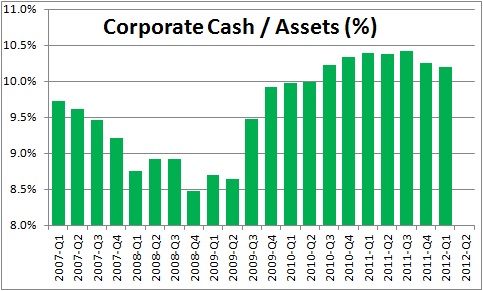
Corporations are flush with cash. They accumulated vast sums of cash in the first two years of the expansion. But in recent quarters their cash holdings have risen far more slowly as corporate leaders apparently think they have adequate reserves to carry them through any temporary difficulty caused by Europe. They may also feel a need to deploy some of their cash holdings into more productive uses. After all, returns on cash holdings these days are close to 0%. Stockholders expect returns of 8-10%. Corporate leaders cannot sit on huge amounts of cash for a long period of time.
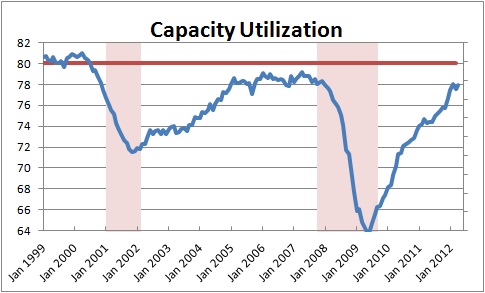
In addition, the manufacturing sector has been expanding rapidly in the first couple of years of the expansion. As a result, the utilization rate has risen close to its historic high level. This means that there is a growing need for factory owners to boost plant capacity which is one type of investment spending.
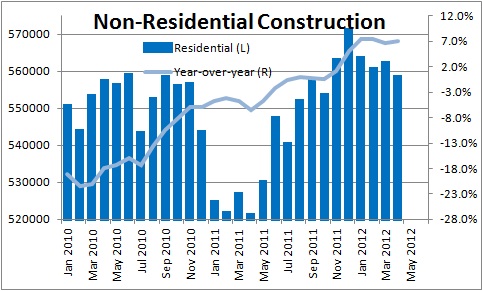
In addition, construction spending has been climbing rapidly since the spring of last year. Some of this pickup reflects a faster pace of residential construction which was discussed earlier. But nonresidential construction (which is twice as big as residential construction) has climbed just as rapidly. What are they building? Factories, power plants, schools and offices have all been rising at roughly a 20% pace in the past year. To some extent this strength in private construction spending is being partly offset by a decline in public construction which obviously reflects budget constraints. Given excessive government spending at all levels, that may not be such a bad thing.
Finally, government spending has declined sharply in each of the past two quarters as the war in Iraq comes to a close. That, in turn, has slowed the pace of GDP expansion. For example, in the fourth quarter of last year GDP growth came in at 3.0%. But it was reduced 0.7% as a result of the curtailment of defense spending. In its absence GDP growth in that quarter would have been 3.7%. Similarly, in the first quarter GDP growth of 1.9% would have been 0.5% higher or 2.4% in the absence of cuts in defense spending. Clearly, this reduced pace of spending occurred far more rapidly than we had expected, but budget data suggest that the bulk of the cuts and its negative impact on GDP growth are behind us.
Conclusion
As we analyze the four factors that have contributed to the slower pace of GDP expansion than we expected in the first half of 2012, our sense is that they are largely one-off events that should not negatively impact growth in subsequent quarters.
Gasoline prices rose early in the year but are now falling just as rapidly.
The weather has distorted the pattern of growth early in the year but will not impact the pace of economic activity going forward.
Reduced defense spending should be a far less important factor in reducing GDP growth in the second half of this year.
The one lingering concern is the situation in Europe. Regardless of the outcome of Sunday’s election this will continue to be a disquieting factor for some time to come as concerns shift from Greece to Spain and Italy.
The bottom line is that we continue to expect faster GDP growth in the second half of this year, but for the year as a whole we have lowered our forecast from 3.0% at the end of last year to 2.6%. You will recall that at the end of last year the consensus was for 2012 GDP growth of 2.2%. Thus, we remain more optimistic than most, but the difference is less dramatic.
| 2011 | 2012 | 2011 | 2012 | |||||||
| Q3 | Q4 | Q1 | Q2 | Q3 | Q4 | |||||
| Real GDP | 1.8% | 3.0% | 1.9% | 2.7% | 2.8% | 3.1% | 1.6% | 2.6% | ||
| Consumer Spending | 1.7% | 2.1% | 2.7% | 2.5% | 2.4% | 2.8% | 1.6% | 2.6% | ||
| Durables | 5.7% | 16.1% | 14.3% | 4.0% | 8.0% | 9.0% | 6.8% | 8.9% | ||
| Nondurables | -0.5% | 0.8% | 2.3% | 0.9% | 1.5% | 1.5% | 0.5% | 1.6% | ||
| Services | 1.9% | 0.4% | 1.0% | 0.9% | 1.4% | 1.8% | 1.2% | 1.3% | ||
| Investment Spending | 1.3% | 22.1% | 6.3% | 5.7% | 8.6% | 8.7% | 8.1% | 7.5% | ||
| Nonresidential Structures | 14.4% | -0.9% | -3.3% | 4.0% | 8.0% | 9.0% | 4.4% | 4.4% | ||
| Equipment | 16.2% | 7.5% | 3.9% | 5.0% | 7.0% | 7.0% | 9.6% | 5.8% | ||
| Residential | 1.3% | 11.6% | 19.4% | 9.0% | 9.0% | 10.0% | 3.5% | 12.0% | ||
| Inventory Change | -$2.0 | $52.2 | $57.7 | $65.0 | $70.0 | $75.0 | ||||
| Trade | -$402.8 | -$410.8 | -$411.9 | -$417.0 | -$416.6 | -$416.1 | ||||
| Exports | 4.7% | 2.7% | 7.2% | 5.0% | 5.0% | 5.0% | 4.7% | 5.6% | ||
| Imports | 1.2% | 3.7% | 6.1% | 5.0% | 4.0% | 4.0% | 3.6% | 4.8% | ||
| Government | -0.1% | -4.2% | -3.9% | -0.2% | -0.9% | -0.9% | -2.8% | -1.5% | ||
| Federal — Defense | 5.0% | -12.1% | -8.3% | -2.0% | -2.0% | -2.0% | -3.6% | -3.6% | ||
| Federal — Nondefense | -3.8% | 4.5% | -0.8% | -0.8% | -0.8% | -0.8% | -2.5% | -0.8% | ||
| State & Local | -1.6% | -2.2% | -2.5% | -0.8% | -0.4% | -0.4% | -2.5% | -1.0% | ||
| Final Sales | 0.0% | 1.1% | 1.7% | 2.3% | 2.6% | 3.0% | 1.5% | 2.4% | ||
| Gross Domestic Purchases | 1.3% | 3.1% | 1.9% | 2.8% | 2.7% | 3.0% | 1.5% | 2.6% | ||
| Final Sales of Domes. Prod. | 2.7% | 1.3% | 1.7% | 2.4% | 2.5% | 2.9% | 1.4% | 2.4% | ||
| Inflation | ||||||||||
| CPI | 3.9% | 3.0% | 2.6% | 1.6% | 1.0% | 1.4% | 3.0% | 1.4% | ||
| Core CPI | 2.0% | 2.2% | 2.3% | 2.2% | 2.3% | 2.4% | 2.2% | 2.4% | ||
| Unemployment Rate | 9.1% | 8.5% | 8.2% | 8.2% | 8.0% | 7.7% | 7.9% | 7.6% | ||
| Fed Funds Rate | 0.08% | 0.07% | 0.13% | 0.10% | 0.10% | 0.10% | 0.07% | 0.10% | ||
| 10-year Treasury | 1.98% | 1.98% | 2.17% | 1.60% | 1.70% | 1.80% | 1.98% | 1.80% | ||
| Yield Curve | 1.90% | 1.91% | 2.04% | 1.50% | 1.60% | 1.70% | 1.91% | 1.70% | ||
Stephen Slifer
NumberNomics
Charleston, SC
thanx Steve. Hope your right and I thank you for wading thru all this interrelated data and coming up with your answers.
Hi Randy. I guess we will see. My biggest worry is Europe. The election this weekend will undoubedly make for a volatile day on Monday.
Steve,,
The stats on real estate from the cost of money to decreases in existing home inventory, etc. bodes well for increased consumer confidence. Thank you for providing this each week, I share this with staff and we pass this type of information along to prospective buyers.
Hi Rick. Glad it is helpful. The economy seems on a reasonable growth track for now. But I am a bit worried about the election in Greece over the weekend. We are almost certain to get a sharp reaction one way or the other on Monday morning.
Steve