January 5, 2024
The very early economic data reported for December were confusing to say the least. Payroll employment climbed 216 thousand in December which was bigger than anticipated, but the civilian employment measure used in calculating the unemployment rate plunged by 683 thousand. That is a huge and largely irreconcilable difference! At the same time, the purchasing managers’ index for the service sector in December declined sharply because of a breathtaking decline in the employment category – a drop roughly comparable to what happened in March and April 2020 when the economy shut down. Clearly such divergences in important economic indicators for December cloud the overall economic outlook. Those differences cannot be explained until additional information is received. For that reason we continue to anticipate a moderate pace of economic activity and a gradual reduction in the inflation rate. That combo will eventually lead the Federal Reserve to cut rates, but there does not appear to be any great urgency to do so. Stay tuned.
Payroll employment rose 216 thousand in December which was more than the 170 thousand increase that had been anticipated. The unemployment rate remained at 3.7%. At first blush, the report seemed to be stronger than anticipated. Moments later as economists dug into the details, they learned that civilian employment, which is the measure used to calculate the unemployment rate, plunged by 683 thousand. That is quite a difference! Which measure are we supposed to believe? These two employment measures come from separate surveys. Payroll employment comes from the “establishment survey” which is reported every month by a large number of firms. It is generally regarded as the more accurate barometer of employment. Civilian employment comes from the so-called “household survey” which is calculated by knocking on people’s doors and asking them if they have a job. One conceptual difference is that the household survey includes people who are self-employed which would not be captured in the establishment survey, but that technical difference is hard pressed to explain the 900 thousand divergence in the two measures for December. In the end, there is always monthly noise between the two series but, over time, they seem to show roughly comparable gains in employment.
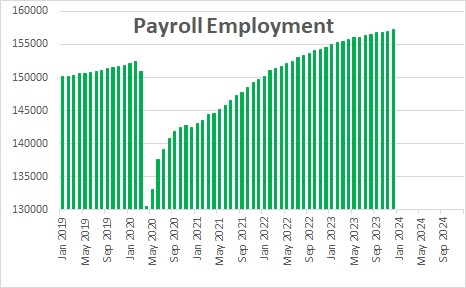
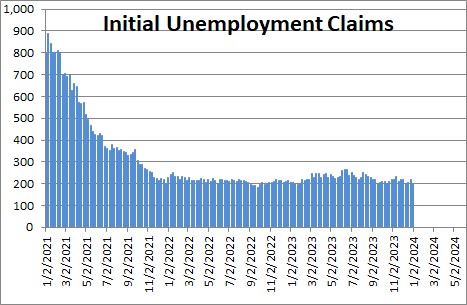
The weekly data on layoffs (initial unemployment claims) have shown no such deterioration in the employment outlook. As a result we tend to believe the payroll employment gain of 216 thousand.
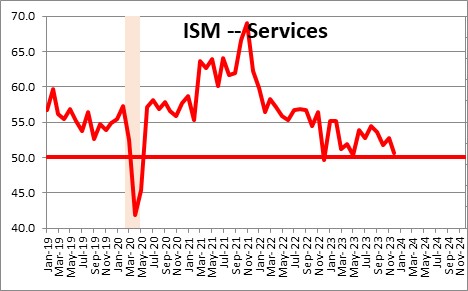
A few hours later, the Institute for Supply Management released its survey of service sector firms for December. The overall index declined 2.1 points in December to 50.6. Keep in mind that the breakeven point is 50.0. A reading above 50.0 indicates that the service sector is expanding. Below 50.0 it is contracting. Thus, the reported drop would suggest a significant softening in the pace of activity in the service sector in December. But a closer inspection of the data makes this outcome questionable.
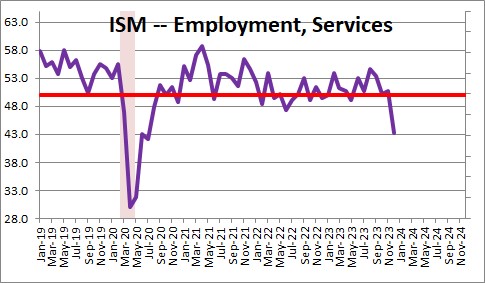
The overall index is calculated from a variety of different components. In this case, the decline was largely attributable to a sharp drop in the employment component which fell 7.4 points in December from 50.7 to 43.3. If one believes those two numbers literally, employment in the service sector went from adding a few jobs in November to contracting sharply in December. Given that the weekly data on layoffs noted above do not show any significant change in labor market conditions, such a drop seems almost unbelievable. In fact, the behavior of this component in December is comparable to what happened in March and April 2020 when the government basically shut down the economy. Seriously? Viewed in that context the December drop in the employment category for the service sector seems misleading. It does not seem to fit with everything else that we know.
Given all of this conflicting data regarding the pace of economic activity and the state of the labor market, we continue to expect GDP growth to register 1.8% growth in the fourth quarter which we will see at the end of this month. We also expect slower growth of 0.7% in both the first and second quarters of this year. Slow, but no recession.
On the inflation front we continue to be guided by the money supply. As we have explained on numerous occasions, the Fed’s dramatic purchases of securities in 2020 as the economy plunged into recession caused money supply growth to skyrocket and thereby provide additional liquidity to the economy. At its peak in early 2021 the economy had $4.0 trillion of surplus liquidity which fueled the subsequent surge in inflation. Beginning in March 2022 the Fed began reducing its holdings of Treasury securities and, as a result, growth in the money supply has steadily declined and surplus liquidity has been reduced to about $1.0 trillion. If the Fed continues this process all surplus liquidity should be eliminated by spring.
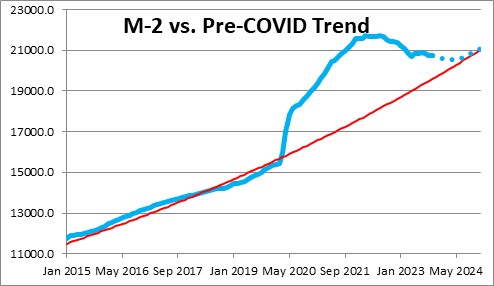
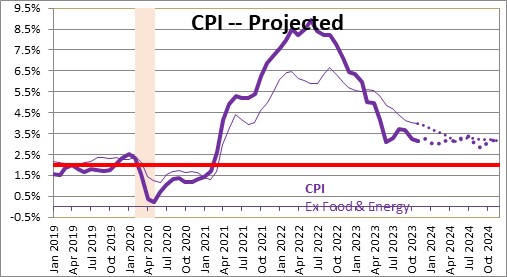
This reduction of surplus liquidity has helped the various inflation measures slow more rapidly than anyone expected. As this process continues we are confident that the inflation rate will further abate and inch closer to the desired 2.0% pace.
The soft-landing scenario described above will eventually lead the Fed to initiate the easing process. But if the economy continues to crank out new jobs and inflation remains above the 2.0% mark, they do not have to rush to begin that process. We continue to expect the initial rate cut to occur in the summer. The current 5.5% funds rate may decline to 4.75% by the end of this year, and then continue on its way to what the Fed thinks is its long-term equilibrium level of 2.5% by the end of 2025.
What’s not to like?
Stephen Slifer
NumberNomics
Follow Me