May 27, 2022
For months the discussion has focused on the highest inflation rate in 40 years and how to shrink it to the Fed’s desired 2.0% pace. The Fed seems to think it can accomplish that objective by raising the funds rate to 2.75% by the end of this year and keeping it at that level in 2023. It also plans to shrink its balance sheet slowly initially and then reducing it by nearly $100 billion per month beginning in October. In our view a 2.75% funds rate is unlikely to accomplish that objective because at that level the real funds rate will remain negative. Negative real rates will not slow the pace of economic activity. For the Fed’s plan to work inflation must shrink to 2.5% or so quickly. With a funds rate of 2.75% and inflation of 2.5% the real funds rate would be +0.5%. That might do the job. But given that signs of inflation are everywhere – from energy and non-energy commodity prices to the labor market and the housing market – with no hint of subsiding any time soon, we are skeptical. But there has been a recent development that could bring the inflation rate down more quickly than we envision. We are talking about a recent dramatic slowing in the rate of growth of the money supply.
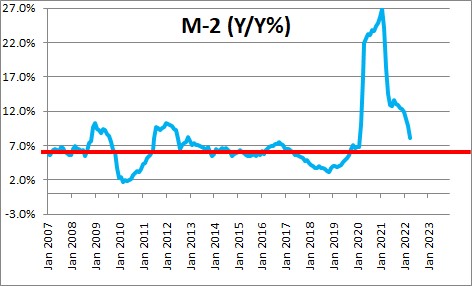
We have long argued that the recent burst of inflation was not temporary but, rather, the predictable result of unprecedented growth in the money supply. Prior to the 2020 recession the M-2 measure of money had for years grown steadily at an average rate of 6.0% which puts it roughly in line with growth in nominal GDP. During the 2020 recession the Fed purchased $2.5 trillion of U.S. Treasury and mortgage-backed securities and money growth soared. The Fed added fuel to the fire by continuing to buy securities every month through March 2022. As a result, money growth exploded in the spring of 2020 and continued to grow at a double-digit rate through the early part of this year. In the past twelve months its growth rate has been 8.0%.
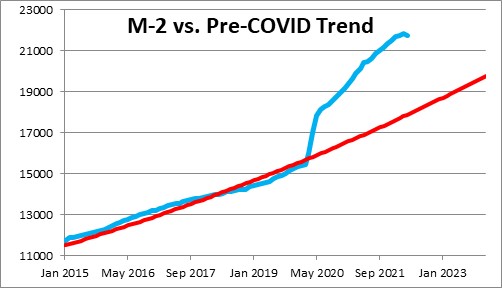
What is important is that the level of M-2 exploded in the spring of 2020 and surged far above its 6.0% desired growth path. It continued to expand at a double-digit pace every month thereafter and it climbed farther and farther above its 6.0% long-term growth path. It is currently $4.0 trillion above that longer-term trajectory. What that means is that there is $4.0 trillion of surplus liquidity in the economy. No wonder we have an inflation problem! Inflation will not subside until such time as the Fed eliminates this excess liquidity.
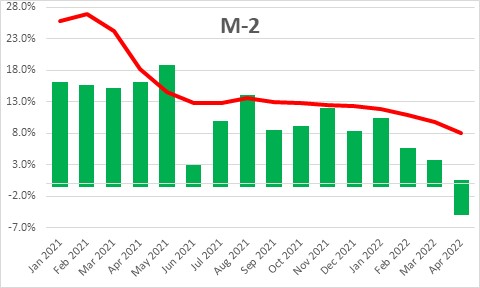
But help is on the way. What has gone virtually unnoticed is that money growth has slowed dramatically in recent months. Following almost two years of double-digit growth, M-2 slowed to a 5.0% pace in February, 3.2% in March, and then an astonishing 4.5% decline in April.
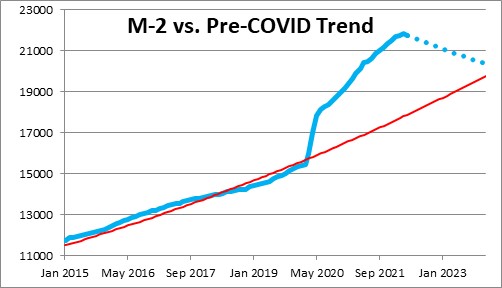
We do not know what path the Fed wants the money supply to follow, but it is clear that it is aware of the excess liquidity problem and intends to do something about it. If it should allow M-2 to decline at a 4.0% pace every month going forward, the excess liquidity would shrink from $4.0 trillion currently to $0.5 trillion by the end of next year.
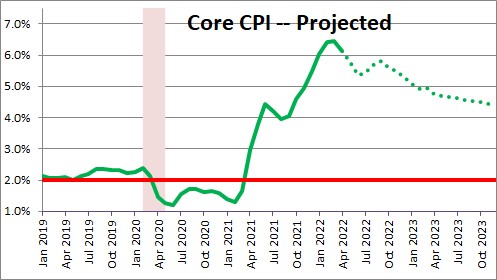
Just as the 2020 explosion in money growth was unprecedented, a protracted decline in the money supply would be equally record-shattering. While we do not know if the money supply will continue to contract in the months ahead, it appears that the Fed is more focused on eliminating the excess liquidity in the economy than we thought previously. As a result, we have trimmed our projections for the core CPI from 6.4% this year to 5.8% and from 5.3% in 2023 to 4.4%. But even with this slower inflation outlook the real funds rate would be -2.8% at the end of this year and -0.9% at the end of 2023. As long as those real rates remain negative we should not expect much slowing in the pace of economic activity.
Stephen Slifer
NumberNomics
Charleston, S.C.
Cautiously optimistic commentary, which is well received in this economic environment – my question is what has caused this “dramatic” change in M2 and why has this decline “gone virtually unnoticed”
Both good questions. First, re: the “virtually unnoticed” comment, M-2 for April was released just 3 days ago. It is no longer a “major” indicator so perhaps economists have not yet focused on it. It is one thing to slow to a 5.0% rate in February and 3.2% in March. A definite slowdown, but not nearly as eye-catching as the 4.5% decline in April. M-2 does not do that. The last time M-2 declined in a single month was in March 2010. Prior to that it was 2003. The question is what’s next? Given that the M-2 explosion in the past two years was unprecedented, perhaps the Fed needs to shrink M-2 for a protracted period of time, which would also be unprecedented.
It appears that the M-2 decline was attributable to a modest decline in excess reserves at the Fed. What declined was not the Fed’s holdings of securities, but some non-security items that surged as part of the stimulus package in response to COVID, specifically the Paycheck Protection Program (PPP) and the Main Street Lending facility which was made to slightly larger firms than those offered by PPP.
A surprising drop to be sure. Thus far it is only for a single-month. We will see what happens going forward.