August 19, 2022
We have argued for some time that the underlying cause of the current soaring inflation rate was the surge in money supply growth that began in March and April 2020. Money growth skyrocketed as the Fed expanded its balance sheet by $3.0 trillion in the spring of that year. The Fed continued to buy securities every month from then until the end of March 2022 and money growth remained rapid. It flooded the economy with trillions of dollars of excess liquidity.
The M-2 measure of the money supply is the sum of a number of different assets that can be used to purchase goods and services. Specifically, it consists largely of checking accounts, savings accounts, money market fund balance, and small CD’s that we could be used to purchase something today if we were so inclined. In short, it measures what’s in our wallet. If we have money in our pocket it tends to burn a hole, so rapid money growth can stimulate spending which, in turn, boosts inflation.
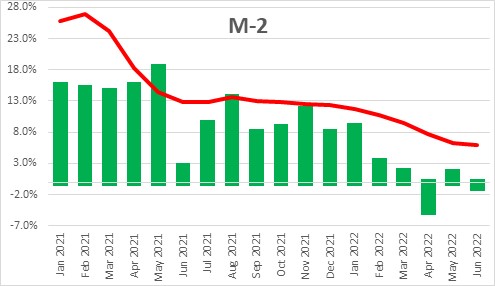
Typically the M-2 measure of the money supply grows by about 6.0% every year which is roughly in line with the growth rate of nominal GDP. At its peak year-over-year growth in M-2 peaked at 27% in February 2021. Its growth rate subsequently slowed but continued to expand at roughly a double-digit pace through the end of 2021.
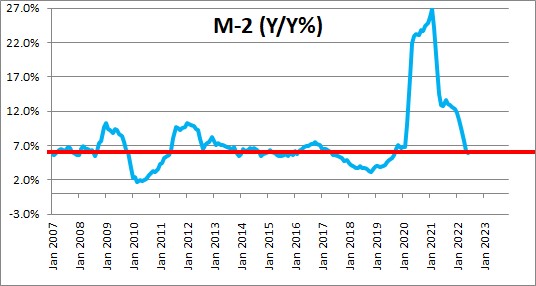
But beginning in February of this year and continuing through June money growth has slowed dramatically. In the five-month period between February and June M-2 was unchanged. That dramatic slowdown in money growth has gone largely unnoticed. Of the economists who have paid attention some now fret that 0% money growth is far too slow and the Fed is likely to push the economy into a deep recession if the lack of growth in the money supply continues.
We do not share their concern about non-existent money growth – at least for the foreseeable future. The reason is that when money growth soared in the spring of 2020 and continued to grow at a double-digit pace for the next 18 months, the level of M-2 climbed farther and farther above target. At its peak in February of this year it was $4.0 trillion above target. Given the lack of growth in recent months it now stands $3.6 trillion above target. The difference between the current level of M-2 (the blue line) and its longer-run path (the red line) represents excess liquidity in the economy.
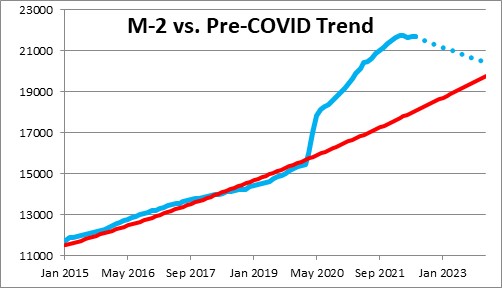
It will take years to eliminate that excess liquidity. If the Fed can cause M-2 to decline at a 4.0% pace every month going forward, the bulk of the excess liquidity will be eliminated by the end of next year. But the reality is that the Fed is not going to allow money growth to decline at a 4.0% pace for an extended period of time which means surplus liquidity will be ample for several years.
The fact that money supply growth has stopped growing is a good thing. But as long as there is surplus liquidity in the economy it is unlikely the inflation rate will shrink to the Fed’s desired 2.0% pace.
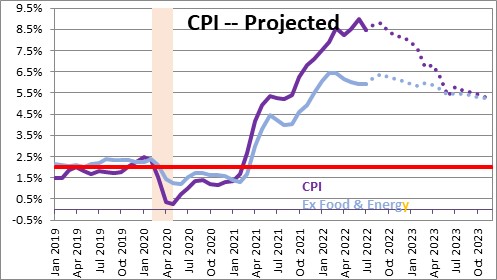
We believe that the 9.1% year-over-year increase in the CPI for June was probably the peak inflation rate. It will slow, but to what? Will inflation approach the Fed’s desired 2.0% target inflation rate quickly? Or will it prove to be more stubborn and remain above 5.0% for the foreseeable future. We expect the CPI to increase 8.1% this year and slow to 5.2% by the end of 2023. Excluding the volatile food and energy categories we expect the so-called core CPI to rise 6.0% this year and 5.2% in 2023. All of those numbers are more than double the Fed’s 2.0% target.
If that is the case, the pressure will remain on the Fed to keep raising interest rates. At its meeting in June the Fed suggested that a federal funds rate of 3.4% by the end of this year and 3.8% at the end of 2023 would be sufficient to reduce inflation to 2.7% by the end of next year. If inflation behaves that nicely then those rates seem appropriate.
But, as we see it, the Fed is not going to slow growth sufficiently as long as the funds rate remains below the inflation rate. In other words, the real funds rate remains negative. The economy is not going to slow sharply with a negative real funds rate. Even the Fed seems to believe this. In its longer run forecast, to produce 1.8% GDP growth and 2.0% inflation, the Fed needs a funds rate of 2.5% — i.e., it needs a positive real funds rate.
How high rates will eventually need to go depends greatly upon how quickly the inflation rate slows. If it Fed is right that inflation slows quickly to 2.7% by the end of next year, then a 3.8% funds rate should do the trick and allow the Fed to actually lower rates in 2024.
But if we are right and by the end of 2023 the inflation rate remains elevated at 5.2%, the funds rate will need to be 5.0% or higher. At the end of 2023 we expect the funds rate to be 5.0% and the inflation rate to be 5.2% — still slightly negative in real terms. The market currently believes that the Fed will be right, inflation will slow quickly, and the Fed may be in a position to reduce rates by the middle of 2023. If we are right, both the stock and bond markets are wildly optimistic and will eventually have to do a rethink. As always, we will see.
Stephen Slifer
NumberNomics
Charleston, S.C.
Thank you for the great analysis.
Hi Moose,
Nice to hear from you. Hope all is well.