July 28, 2023
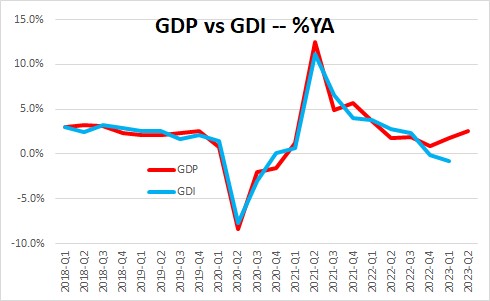
GDP climbed 2.4% in the second quarter, 2.0% in the first quarter and 2.6% in the fourth quarter. Clearly, the economy is on a roll. Economists – including those at the Fed — are quickly abandoning their recession forecasts and concluding that the Fed may have successfully pulled off a soft landing. But while GDP growth in recent quarters appears solid, the economy is not nearly as robust as the headline data suggest There is an alternative measure of economic activity called Gross Domestic Income (GDI). In theory the two measures should be identical. But they never are because they are derived from separate income streams. Growth rates for the two measures track closely over time, but there can be big variations in any given quarter. For example, in contrast to the solid GDP growth registered in the fourth quarter of last year and the first quarter of this year, GDI declined 3.3% and 1.8%, respectively. As a result, some economists have concluded that the U.S. economy actually entered a recession late last year. What gives? How can this be? Which measure of economic activity are we supposed to believe?
Estimating how quickly the economy is expanding is never easy. The GDP data are the most widely used barometer. But there is an alternative measure called Gross Domestic Income or GDI. In theory the two measures should be identical. GDP counts the value of all the goods and services produced in any given quarter (consumer spending, investment, trade, government expenditures). GDI counts what all participants make from the sale of those goods (i.e. wages, profits, taxes). But the two measures are never identical because they are derived from separate sources. Over time the growth rates are similar, but in any given quarter the differences can be dramatic. Consider the following. In the fourth quarter GDP rose 2.6%. GDI declined 3.3%. In the first quarter GDP rose 2.0%. GDI declined 1.8%. One measure says the economy is expanding at a reasonably robust pace. The other says that the economy was in a recession earlier this year. That is a dramatic difference that far exceeds the normal quarterly wiggles. For the second quarter we recently learned that GDP rose 2.4%. We do not yet know what happened to GDI because it is released with a one-month lag and will not be available until the end of August. Will it continue to decline?
The Bureau of Economic Analysis believes that the GDP data are a better gauge of economic activity than GDI because they are more timely. Having said that, the BEA produces both the GDP and GDI measures and has indicated that there is no really good way to determine which measure of economic activity is more accurate. Thus, it produces a third estimate of economic activity which is the average of the GDP and GDI growth rates. As one might expect, this dampens the difference between the two measures, but it does not provide any new information. Using this average measure, economic activity declined 0.4% in the fourth quarter and rose 0.1% in the first quarter. This means that in recent quarters the economy grew at a solid pace, fell into recession, or muddled along. That is decidedly unhelpful. None of us – including the Fed — have any idea what really happened to the economy in recent quarters. Part of the mystery may be resolved when the BEA publishes its first estimate of GDI for the second quarter on August 30. Then, based on more complete data once a year the BEA revises all of its GDP and GDI statistics going back for several years. That is scheduled to occur on September 28. Unfortunately, that is still two months down the road. Is there anything else we can use to give us some sense of what is actually happening?
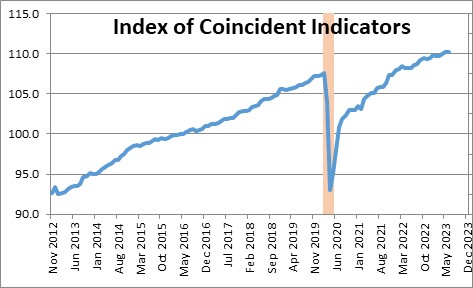
The index of coincident indicators is produced monthly by The Conference Board. The index consists of four economic indicators each of which rise or fall roughly coincident with the overall pace of economic activity. One such indicator is payroll employment, which has been climbing rapidly and is contributing positively to the overall index. Another coincident indicator is industrial production, which has declined slightly in recent months and countered some of the strength contributed by employment. As a result, this measure of current economic activity has been essentially unchanged for the past six months, which seems roughly consistent with the average of the GDP and GDP data.
The bottom line is that we simply cannot be certain what is going on. Given the steady gains in employment we certainly do not believe that the economy has been in a recession. Equally important, the surprisingly large declines in GDI suggest that the economy is not nearly as robust as the GDP data indicate. Thus, the Fed’s decision to let the data guide them about what to do next seems warranted.
If the economy is as strong as the GDP data suggest our attention will once again turn to inflation – but not in a good way. In the past three quarters GDP growth has averaged 2.3%. Our economic speed limit is estimated to be 1.8%. There is no remaining slack in the economy. Steady growth in excess of the speed limit will soon begin to push inflation higher and force the Fed to raise rates farther to cool things down. People are thrilled by the recent slowdown in inflation, but the euphoria may be short-lived. Stay tuned.
Stephen Slifer
NumberNomics
Charleston, S.C.
Follow Me