May 2, 2025
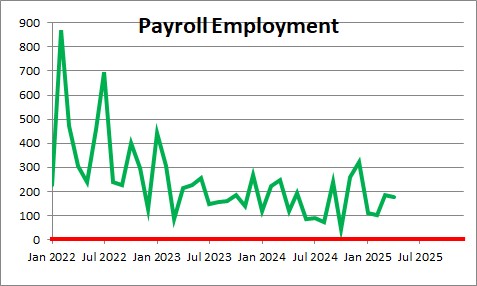
Payroll employment climbed by 177 thousand in April after gaining 185 thousand in March and 102 thousand in February. The job gain exceeded market expectations which were for an increase of 140 thousand. In the past three months payroll employment has risen on average 155 thousand per month.
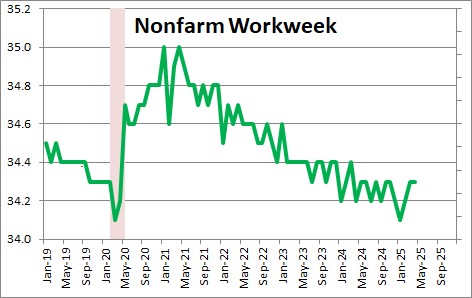
In addition to hiring workers employers can also alter the length of the workweek for their existing workers. The nonfarm workweek was unchanged in April at 34.3 hours after rising 0.1 hour in March. Prior to the recession the nonfarm workweek was averaging 34.4 hours so it is roughly the same as it was five years ago.
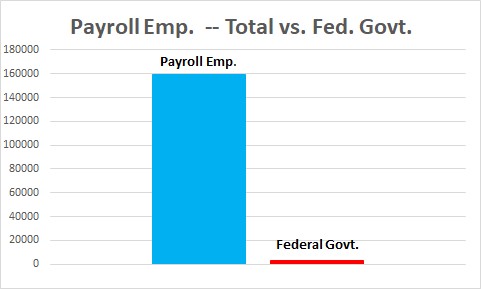
There are few signs that the fear of tariffs on the economy has caused firms to change their view about hiring. They may not be replacing a worker that leaves the company and thereby reducing headcount by attrition but even that seems to be small in the bigger scheme of things. Federal government layoffs are also a minor factor. That is not surprising since Federal government employment is only 2% of the total. Federal government reached a peak in January at 3,015 workers. It is currently 2,989 thousand — a total decline of just 26 thousand or about 9 thousand per month.
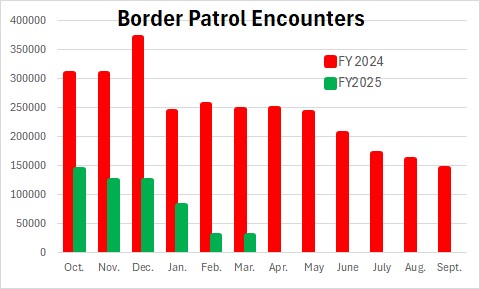
Similarly, people were worried about the loss of immigrant workers. The border has been essentially closed for the past several months, and it is hard to discern any particularly impact on total employment.
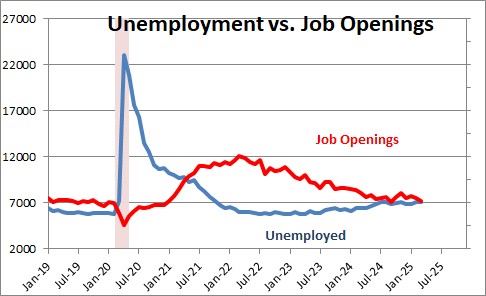
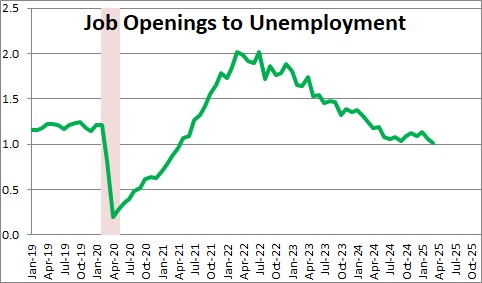
Job openings have fallen from a record high level of 11.7 million in early 2021 to 7.2 million. Prior to the recession there were about 7.0 million job openings per month versus 7.2 million currently. Today there are still 1.0 job openings for every unemployed worker which is just slightly lower than where this was prior to the recession. Employers are nervous but the l labor market is doing OK for now.
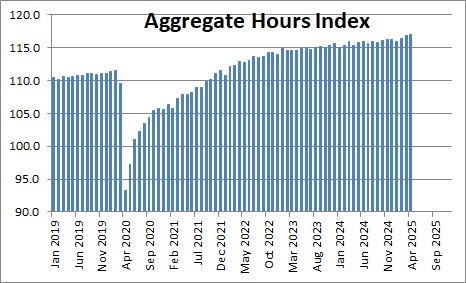
The change in employment and hours worked are reflected in the aggregate hours index rose 0.1% in April to 117.0 after rising 0.4% in March. The aggregate hours index appears to be on track 2.3% in the current quarter. We anticipate a GDP increase of about 2.5% in the second quarter following the 0.3% drop in the first quarter.
Construction employment rose by 11 thousand. Manufacturing employment fell by 1 thousand. Retail trade jobs declined by 2 thousand. Transportation and warehousing rose by 29 thousand. Info tech jobs rose by 2 thousand. Financial sector jobs rose by 14 thousand. Professional and business services rose by 17 thousand.. Health care jobs climbed by 51 thousand. Social assistance gained 8 thousand. Leisure and hospitality jobs gained 24 thousand.(restaurant employment climbed by 17 thousand. Government jobs rose by 10 thousand. Federal government employment declined 9 thousand which puts it 26 thousand below its recent peak level.
We expect GDP to grow about 2.5% in the second quarter and 1.9% for 2025 as a whole.
Stephen Slifer
NumberNomics
Charleston, S.C.
Steve –
In the first two lines, I believe your number for the average is incorrect and should
be 356,000 rather than 234,000.
You area correct Frank. I just changed it. Employment Fridays are tough. So much data to sift through on those days. Need to digest that, write something about each tidbit, and then write the weekly commentary. Easy to miss something.
Thanks for the heads up.
Is there a way to superimpose this data with the number of layoffs over the course of the same timeframe?
I keep hearing that there are a lot more layoffs this year but I don’t know where to verify that. Thanks!
Hi Tina,
I will send you a chart on initial unemployment claims (layoffs) to your e-mail. I would include it here but somehow I cannot figure out how to get these responses to include a chart. The bottom line is that layoffs overall have been dead flat for almost two years. We keep reading about layoffs by various firms, but it appears that those folks who lose their job are easily able to find a job somewhere else.
It could be the the UAW strike is beginning to boost layoffs, but that will presumably be just a temporary jump.
I tried to send the charts to tinacartigane@gmmail.com (shown above). It came back. Changed it to gmail.com. It came back again. If you give me your email address I will resend.