October 4, 2024
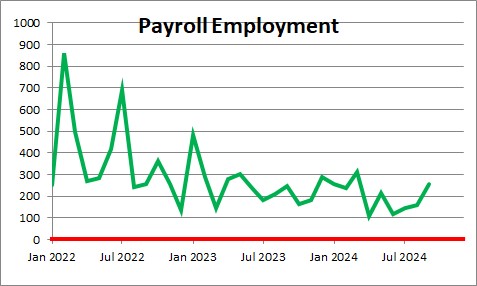
Payroll employment jumped by 254 thousand in September after having risen 159 in August.. In the past three months the average increase has been 186 thousand. The market had expected an increase in payroll employment for September of 150 thousand. There were also upward revisions to the employment data for June and July. Despite the September gain the employment gains still seem to be slowing down. However, jobs still seem to be climbing roughly in line with growth in the labor force which suggests that the labor market should be relatively stable in the months ahead.
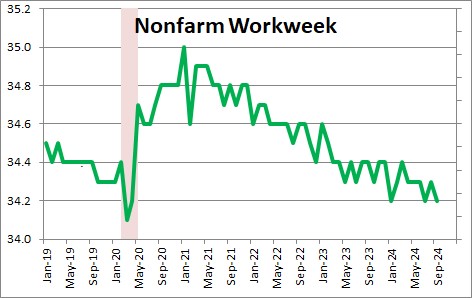
In addition to hiring workers employers can also alter the length of the workweek for their existing workers. The nonfarm workweek declined 0.1 hour in September to 34.2 hours after having risen 0.1 hour in August. Prior to the recession the nonfarm workweek was averaging 34.4 hours so it is weaker than it was four years ago. So while the labor market has softened it does not appear to be falling out of bed.
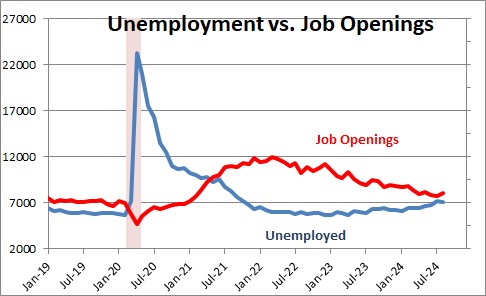
Job openings have fallen from a record high level of 11.7 million in early 2021 to 8.0 million. Prior to the recession there were about 7.0 million job openings per month versus 8.0 million currently. Today there are 1.1 job openings for every unemployed worker which is roughly where this was prior to the recession.
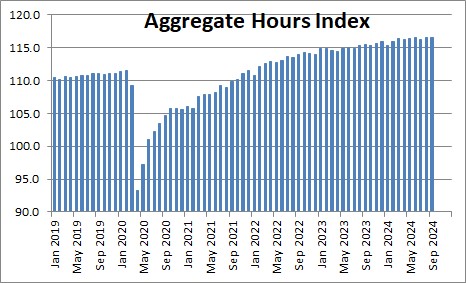
The change in employment and hours worked are reflected in the aggregate hours index which declined 0.1% in September after having risen 0.3% in August. This index rose 0.2% in the third quarter which we believe is reasonably consistent with our projected GDP growth rate of 2.0% in that quarter (because of an expected increase in productivity.
Construction employment rose by 25 thousand. Manufacturing employment declined 7 thousand. Retail trade jobs rose by 16 thousand. Transportation and warehousing declined by 9 thousand. Info tech jobs rose 4 thousand. Financial sector jobs rose by 5 thousand. Professional and business services gained 17 thousand. . Health care jobs climbed by 45 thousand. Social assistance climbed by 27 thousand. Leisure and hospitality jobs jumped by 78 thousand. Government jobs rose by 31 thousand almost exclusively at the state and local level.
Given these steady employment gains we expect GDP growth of 2.0% in the third quarter and 2.5% in the fourth quarter.
Stephen Slifer
NumberNomics
Charleston, S.C.
Steve –
In the first two lines, I believe your number for the average is incorrect and should
be 356,000 rather than 234,000.
You area correct Frank. I just changed it. Employment Fridays are tough. So much data to sift through on those days. Need to digest that, write something about each tidbit, and then write the weekly commentary. Easy to miss something.
Thanks for the heads up.
Is there a way to superimpose this data with the number of layoffs over the course of the same timeframe?
I keep hearing that there are a lot more layoffs this year but I don’t know where to verify that. Thanks!
Hi Tina,
I will send you a chart on initial unemployment claims (layoffs) to your e-mail. I would include it here but somehow I cannot figure out how to get these responses to include a chart. The bottom line is that layoffs overall have been dead flat for almost two years. We keep reading about layoffs by various firms, but it appears that those folks who lose their job are easily able to find a job somewhere else.
It could be the the UAW strike is beginning to boost layoffs, but that will presumably be just a temporary jump.
I tried to send the charts to tinacartigane@gmmail.com (shown above). It came back. Changed it to gmail.com. It came back again. If you give me your email address I will resend.