July 26, 2024
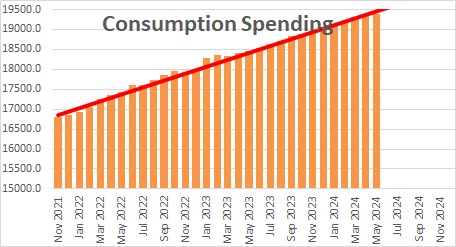
Personal consumption expenditures rose 0.3% in June after gaining 0.4% in May and 0.2% in April. In the past year nominal spending has risen 5.2%.
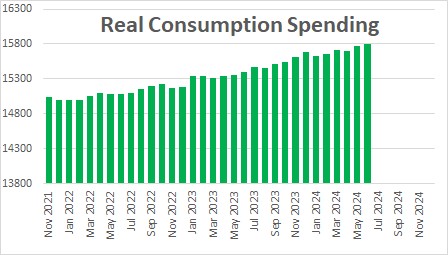
What we are really interested in is “real” or inflation-adjusted spending. That is what goes into the GDP calculation. After adjusting for inflation real consumption spending rose 0.2% in June after climbing 0.4% in May and having declined 0.1% in April In the past year real spending has risen 2.6%. In the past three months that pace has slipped to 2.2%. Thus, the consumer’s willingness to spend may be slowing down — but not much thus far.
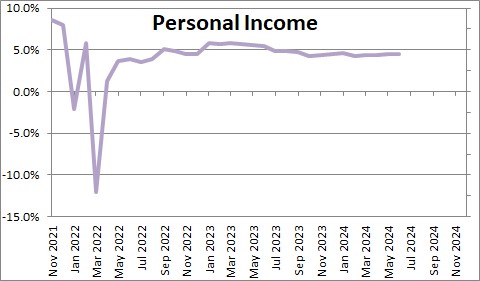
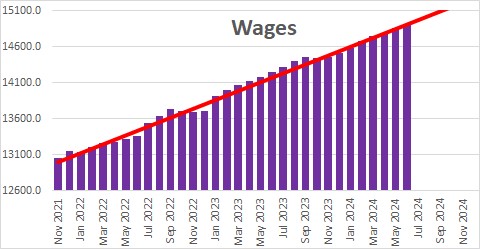
Personal income rose 0.2% in June after increasing 0.4% in May and 0.2% in April. The growth in income is being fueled by growth in wages which climbed 0.3% in June after gaining 0.6% in May and 0.2% in April. Firms are under some pressure to raise wages (given that average hourly earnings in real terms fell for two years). As a result, wages have risen 4.7% in the past year.
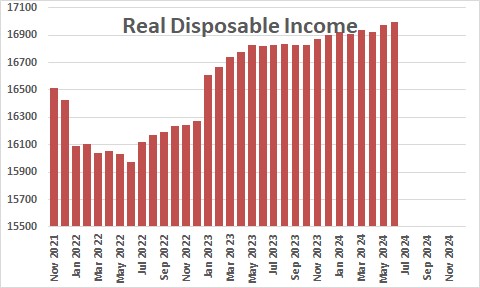
Real disposable income — what is left after paying taxes and adjusted for inflation — rose 0.1% in June after climbing 0.3% in May and having declined 0.1% in April.. In the past year real disposable income has risen 1.0%. This measure needs to grow somewhat more quickly to sustain a 2.6% pace of real consumer spending. That is unlikely to happen which means that the pace of consumer spending should slow in the second half of the year.
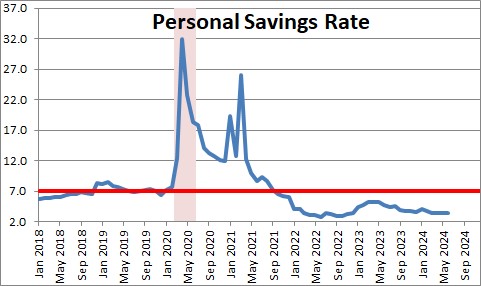
The savings rate fell 0.1% in June to 3.4% being unchanged in April and May. Consumers are saving much less of their paycheck each month than what they have done historically. In the 10-years prior to the 2020 recession the savings rate averaged 7.0%. With real disposable income rising at a 1.0% pace in recent months consumers cannot continue to spend at a 2.6% rate for too much longer.
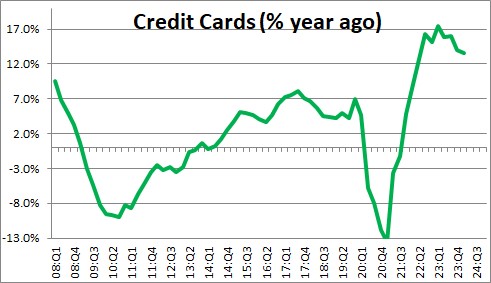
To maintain their pace of spending they are beginning to run up their credit card bills. That is OK for a while because they have very little debt in relation to income currently, but that is not a sustainable situation.
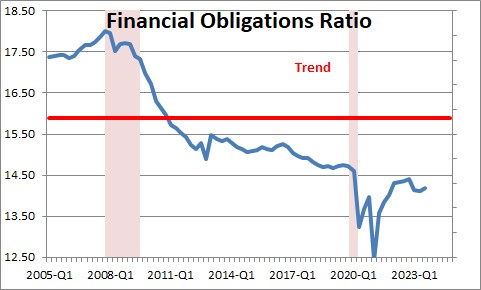
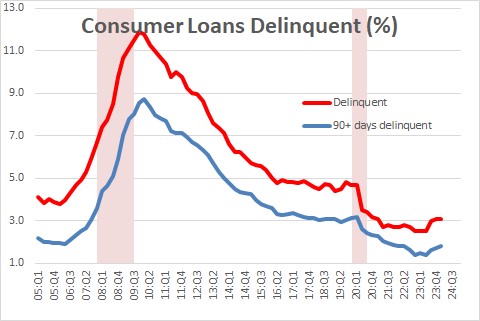
Thus far the additional debt has not been a problem. If that were the case, delinquency rates on consumer debt should have begun to rise. That is not yet the case.
GDP rose 2.8% in the second quarter but then slow to 0.9% in the third quarter and 1.6% in the fourth quarter. Steady job gains and significant wage gains will provide enough fuel to keep the economy growing slowly in the months to come.
Stephen Slifer
NumberNomics
Charleston, SC
Excellent analysis and charts. I am amazed home high consumer confidence remains with all the talk of recession in the media. I just added your site to my sites list of recommended economic links.
I think consumer confidence is based to a large degree on what is happening to the stock market. We all read the stuff that is published in the print media, magazine articles, blogs, tweets, etc. But perhaps there is so much information out that that we get ourselves confused and go back to how all that is affecting the stock market. If we as consumers were seeing obvious signs of prices rising because of the tariffs being applied to Chinese goods perhaps we would be less confident. That may be coming, but we are not there yet.
All the best.
Steve