July 12 2024
The Producer Price Index for final demand includes producer prices for goods, as well as prices for construction, services, government purchases, and exports and covers over 75% of domestic production.
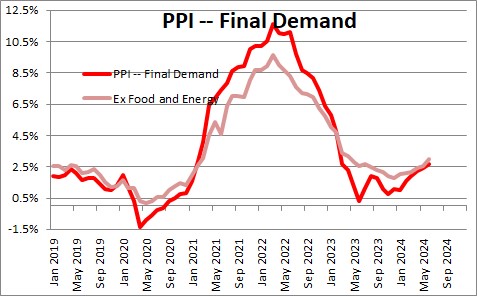
Producer prices for final demand for 0.2% in June after having been unchanged in May. In the past year the PPI has risen 2.7%. After a big slowdown in producer prices last year the PPI has risen slightly in the first half of 2024.
Excluding the volatile food and energy categories, final demand prices rose 0.4% in June after climbing 0.3% in May. Over the past 12 months this index has risen 3.0%. Like the overall index, following a long slide in 2022 prices have risen slightly in the first six months of this year.
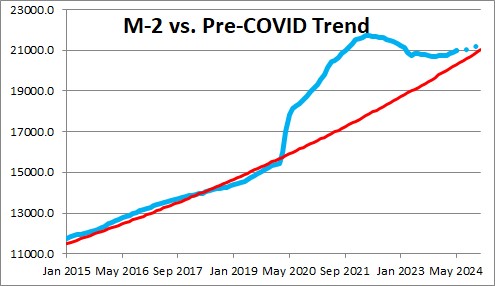
We have seen relatively high inflation because of surplus liquidity in the economy. The cumulative effect of monthly gains in the money supply consistently in excess of the 6.0% M-2 target from March 2020 until March 2022 pushed M-2 almost $4.0 trillion above target. M-2 began to decline in April of 2022 but is still $0.7 trillion above where it should be. It appears that the removal of $3.3 trillion of surplus liquidity is helping to bring inflation back down toward the Fed’s target. If that surplus liquidity continues to shrink we should look for all measures of inflation — including the CPI and the PCE core rate of inflation — to move closer and closer to the Fed’s target.
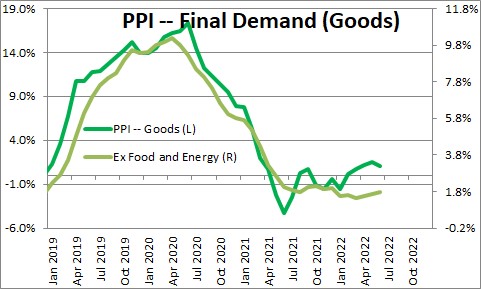
The overall PPI index can be split apart between goods prices and prices for services.
The PPI for final demand of good fell 0.5% in June after having declined 0.8% in May. Excluding the volatile food and energy categories the PPI for goods was unchanged in June after having risen 0.2% in May. This core goods sector inflation index has risen 1.8% in the past year.
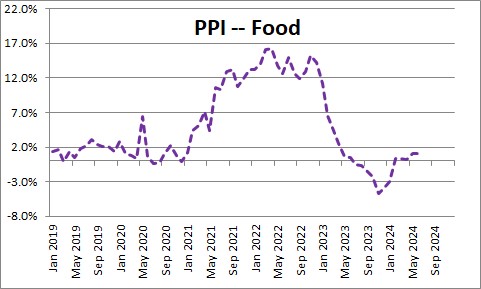
Within the goods sector, food prices fell 0.3% in June after having been unchanged in May. Typically, this is a volatile series. It increases sharply for a few months and then drops back a few months later. In the past year food prices have risen 1.1%.
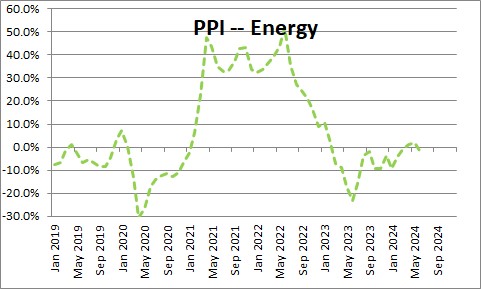
Energy prices declined 2.6% in June after having plunged 4.6% in May. It, too, is a volatile series. In the past year energy prices have fallen 1.3%. This drop reflects the return to a more normal level following the dramatic runup that occured at the beginning of the Ukraine/Russia war.
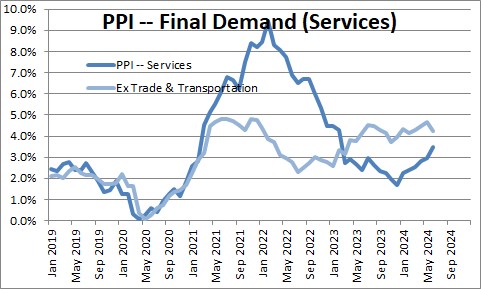
Prices of services jumped 0.6% in June after having risen 0.3% in May. In the past year prices of services have risen 3.5%. Ex transportation and warehousing, service sector prices have climbed 4.2%.
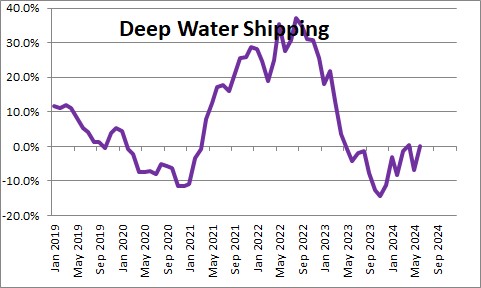
One concern in recent months is that higher shipping costs might filter into these numbers given the drought curtailing shipping through the Panama Canal, and the attacks on merchant ships in the Red Sea. While prices rose somewhat late last year the deep water shipping category of the transportation component has risen 0.1% in the past year.
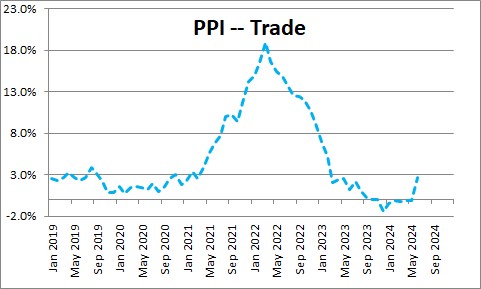
The big jump in the services component in June was attributable to the trade component which jumped 1.9% and has risen 2.7% in the past year. This category reflects margins received by wholesalers and retailers.
Because the PPI measures the cost of materials for manufacturers, it is frequently believed to be a leading indicator of what might happen to consumer prices at a somewhat later date. However, that connection is very loose. It is important to remember that labor costs represent about two-thirds of the price of a product while materials account for the remaining one-third. Those labor costs are better captured in the CPI. Also, the CPI is being inflated by the shelter component, led by rents but also automobile insurance and car repairs..
The core CPI is expected to increase 3.1% in 2024. It is not expected to return to the Fed’s 2.0% target pace until 2026..
Stephen Slifer
NumberNomics
Charleston, SC
The vertical axis on your graphs is not labeled and is confusing. It appears the scale reflects the interval change in the rates, not the absolute rates.
Hi Frank. Thanks for your comment. I looked at the PPI chart and I am not sure I understand your confusion. It is the year-over-year percent change in each series. I typically do not show the monthly change in my charts because they tend to be so volatile. With the y-o-y change you can more easily see the change in trend.
Steve Slifer
Steve –
Don’t understand your comment above that the money supply will remain elevated
throughout 2022. I thought the Fed was going to stop QE bond purchases after March and start to shrink their inventory after that. Why will the money supply
remain elevated?
Hi Frank,
A couple of things. First of all, the Fed has said that it will stop its monthly purchases of securities by the end of March. Between now and then its balance sheet and, presumably, money growth will continue to be rapid. It has not yet said when it will begin to actually shrink its balance sheet. Details of that will probably come some time in the first quarter. But at that point it will begin raising interest rates. It seems to me that they will probably not do both simultaneously — kind of a double dose of tightening.
If that is the case, then money supply growth will slow from about 13% currently to perhaps 8% or so next year (remember the Fed keeps buying securities through March). Historically, it needs 5-6% growth (roughly in line with desired nominal GDP growth). But 8% is faster than 5-6%, hence money growth will remain elevated. But going even farther, money growth has been so rapid for so long that its level is far above where it would have been if it had growth 5-6% throughout that period. It actually need 0% money growth for a while to get the level of the money stock back in line with where it should be. To put that another way, it needs to wipe out the excess liquidity that is currently in the economy.
Does that make sense?
Steve