June 3, 2016
The employment report for May was one of the most confusing we have seen in years. Payroll employment rose a much-smaller-than-expected 38 thousand in May but, simultaneously, the unemployment rate plunged 0.3% to 4.7%. What gives?
Perhaps the most important part of the report is the much-smaller-than-expected 38 thousand increase in payroll employment. Is this a sign of emerging economic weakness? Is it an indication that the economy is at full employment which makes it hard to sustain job gains of 200 thousand per month? Or perhaps some of both?
About once a year payroll employment increases by less than 100 thousand workers. It happened in January 2011, June 2012, December 2013, March 2015, and now May 2016. Those minuscule increases were attributable to bad weather, strikes, or perhaps inappropriate seasonal adjustment factors (which compare the change in employment for any given month to the “typical” change in employment for that month). In none of those cases was the small single month’s increase in employment indicative of a change in trend.
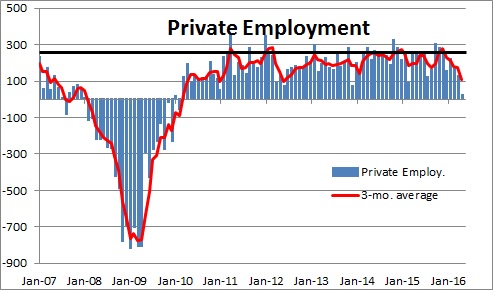
It is difficult to conclude that the minuscule increase in employment in May was caused by softening demand. Take the housing sector for example. Housing is hot. Existing home sales and new home sales are the fastest they have been thus far in the cycle. Available properties for sale are in short supply. But despite these clear indications of robust demand, construction employment declined in both April and May. That makes no sense. Keep in mind that no other labor market indicators are confirming that sort of a slowdown. The ADP report for May registered an increase of 173 thousand. And initial unemployment claims (a measure of layoffs) is as low as it has been since the 1970’s. Two thoughts occur to us.
First, April and May are spring months when the construction industry shifts into high gear. Hiring is typically very strong in those months. We would suggest that because the labor market is so tight builders were not able to hire as many workers as normal. The seasonal factors expect to see a big increase in employment but, in fact, the increase was smaller than normal. Hence, the “seasonally adjusted” numbers that are published registered a decline. The 15 thousand worker decline in construction employment for May means simply that builders hired 15 thousand fewer workers in May than they typically do. Should this be construed as an indication of emerging weakness in the housing sector? Absolutely not. Furthermore, the soft employment rate also did not include 37 thousand Verizon workers that were on strike (which will eventually end), and the ongoing softness in both the manufacturing and mining categories (which will also soon end).
Second, as the economy approaches (or is at) full employment there is no way to sustain monthly employment gains of 200 thousand. At full employment hiring can grow only as fast as growth in the labor force. Currently, the baby boomers are retiring. When they retire they no longer seek employment and thereby drop out of the labor force. As a result, labor force growth has slowed from 1.5% or so prior to the recession to about 0.5% currently and that growth rate should continue for another decade. Given the current size of the labor force that implies monthly increases of only about 65 thousand per month. When the economy is not at full employment monthly employment gains can be much larger as firms hire from the ranks of unemployed workers. But once the economy reaches full employment those monthly increases are going to shrink. There is no other way for employers to find enough workers to hire.
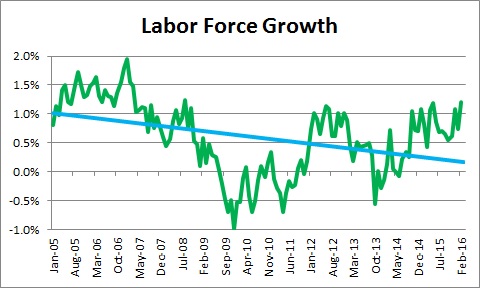
Between October of last year and March 2016 the labor force rose on average 403 thousand per month. It appeared that the strong job market was attracting some long-term unemployed workers who had given up seeking employment. Growth in the labor force rebounded from 0.5% to 1.5%. But in April and May the labor force contracted by 362 thousand and 459 thousand, respectively. Labor force growth has returned to just 0.6%. Did the labor force really rise sharply for six months only to sag dramatically in the two subsequent months? Was there a real increase in the labor force as long-term unemployed workers jumped back into the game? Or was it merely a statistical mirage? Nobody can be sure. This is a very volatile series. The reality is that the current growth rate in the labor force seems more in line with what we had been expecting.
That sharp drop in the labor force in May is why the unemployment rate fell so sharply. The labor force fell by 458 thousand, employment rose 26 thousand. As a result, the number of unemployed workers plunged by 484 thousand and the unemployment rate dropped 0.3% to 4.7% which is below anybody’s estimate of full employment.
The employment report this month seems to take a June rate hike off the table. This report was more confusing than any we have seen in years. Given at least a sniff of weakness, the Fed is likely to conclude that they do not have to rush into another rate hike. It meets again in July and can reassess the situation at that time. We still look for two rate hikes this year. That postponement has the added advantage that the Fed can wait to see the outcome of the Brexit vote on June 23. We believe that the Fed recognizes a need to raise rates so that it will have room to lower rates once the next recession arrives to re-invigorate the economy. But this group has demonstrated a clear bias to wait until the sun, the earth, and the moon are all in alignment before deciding to move. Higher rates are inevitable, but the pace of rate hikes will be determined by the data as they unfold.
Stephen Slifer
NumberNomics
Charleston, SC
Follow Me