October 11, 2019
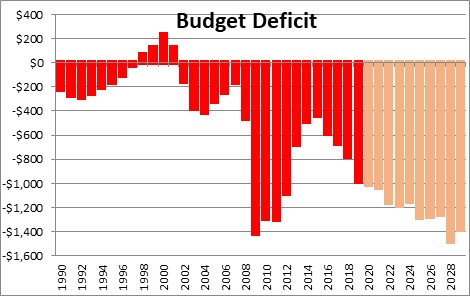
The budget deficit for fiscal 2019 is now in the book. It jumped from $779 billion in 2018 to $984 billion. The only good news is that it managed to stay below the $1.0 trillion level. Unfortunately, that is the last time that will happen. Between now and 2029 the annual deficits are projected to range anywhere from $1.0 to $1.5 trillion. Two things are important. First, whenever the government spends more than it collects from tax revenues, the Treasury is forced to borrow an equal amount to pay its bills. As a result, total Treasury debt outstanding and debt as a percent of GDP continue to climb. This process is not sustainable. Second, nobody cares. The current problem is on the spending side and it can be fixed. Unfortunately, neither political party has the will or the courage to do anything about it.
The $984 billion shortfall in fiscal 2019 is more than $200 bigger than in the previous year.
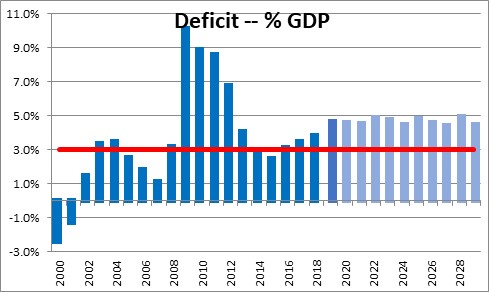
While $1.0 trillion deficits are eye-popping, expressed in dollars they do not really mean much. They need to be gauged relative to the size of the economy. In fiscal 2019 the budget deficit was 4.7% of GDP. Unfortunately, that is still big. Economists generally believe that a budget deficit that is 3.0% of GDP or less is sustainable. So what is going on? Are government tax receipts too low? Government spending too high? Some combination of the two?
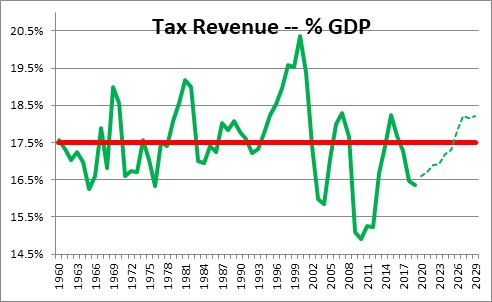
In fiscal 2019 tax revenue came in at 16.4% percent of GDP which is actually a bit below its long-term average of 17.5%. However, the Congressional Budget Office expects tax revenue to return to, and then surpass, its long-term average in the years ahead. While this measure bounces around during that period of time, it will remain roughly in line with its long-term average.
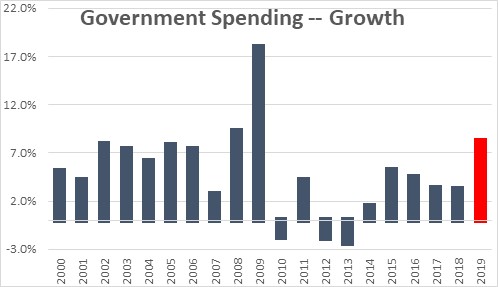
Government spending is a different story. It jumped 8.0% this year which is the fastest growth rate in a decade as defense spending surged.
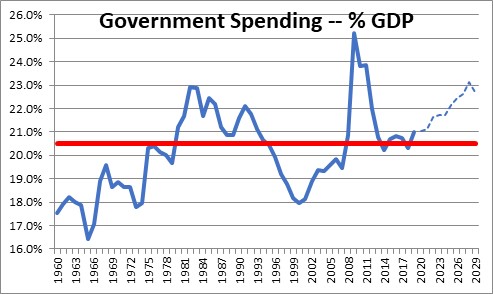
As a result, government spending climbed to 21.0% of GDP this past year which is somewhat above its long-term average of 20.5%. As baby boomers continue to age more of them will begin to receive Social Security benefits and become eligible for Medicare. By 2029 government spending will climb to 23% of GDP. This is pure demographics. It is built in the cake. If we want this steady diet of projected 5.0% budget deficits to shrink to a more manageable level of 3.0% of GDP, we suggest that our leaders in Washington whack government spending by about 2.0% of GDP.
Such a cut in spending is within reach if only we could find the political will to do so. In 2010 the bipartisan Erskine-Bowles commission – 9 Republicans and 9 Democrats – appointed by President Obama outlined what such a path might look like. Let expenses grow at one-half the rate of inflation. Equal cuts for defense and non-defense spending. Reduce Social Security benefits for high income individuals. Gradually increase the retirement age from 66 to 68. Increase the payroll tax maximum from $132 thousand to $190 thousand. For Medicare, do not cover the first $500 of health care expenditures. From $500-$5,000 cover only 50%. Raise the eligibility age from 65 to 68. Interestingly, 11 of the 18 members of the committee agreed to the package. But Obama thought it cut entitlement spending too much and rejected It. Imagine! It was his commission. They did exactly what he asked them to do. Fix everything. As amazing as it may seem, less than a decade ago a bipartisan committee reached an agreement on something important. But Obama said no. What a missed opportunity!
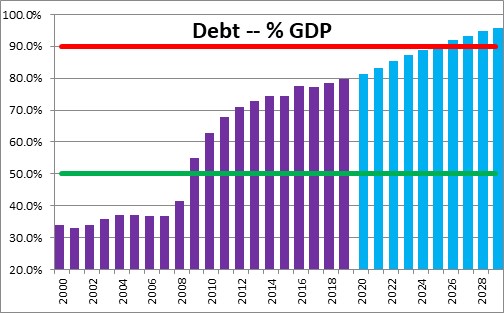
The problem with a budget deficit is that every time one occurs the Treasury must issue an equal amount of debt so the government can pay its bills. Thus, a $1.0 trillion budget deficit means the Treasury must issue $1.0 trillion of debt to finance it. If there is another $1.0 trillion deficit in year two, the Treasury must issue an additional $1.0 trillion of debt. It is cumulative. As a result, both debt outstanding and debt as a percent of GDP continue to climb if the deficits persist. Debt as a percent of GDP has been steadily rising for a decade and last year reached 79% of GDP. Economists generally believe that a debt/GDP ratio of 50% or less is sustainable. They also believe that once that percentage climbs to 90% the debt burden can become problematic. At 79% the current amount of debt is a bit on the high side but perhaps not yet at a danger point. By 2029 the percentage climbs to 95%. Is that a problem? Maybe. In the years beyond as our population continues to age the ratio climbs to 144% of GDP by 2049. Is that a problem? Probably.
As the debt burden climbs the risk of default for U.S. Treasury debt increases. The ratings agencies like Moody’s and Standard and Poor’s will recognize that increased risk by lowering the credit rating for U.S. Treasury securities. A lower credit rating will boost the interest rate that the Treasury must pay. At the same time, foreign and domestic investors may be somewhat less inclined to purchase U.S. Treasury debt and require the Treasury to pay an even higher interest rate.
To put these numbers in context, it is worth noting that Greece currently has a debt/GDP ratio of 183%. Other European countries that have had financing problems in recent years are Italy at 131% and Spain at 97%. To allow the debt/GDP ratio in the U.S. to climb to 95% of GDP by 2029 or 144% later seems irresponsible. And unlike debt laden European countries which have the European Union willing to back their debt, nobody will be able to bail out the U.S. if there is a problem.
Our budget deficits will be in excess of $1.0 trillion every year for at least a decade and probably much longer. Government debt outstanding will climb steadily and reach a danger level within a decade. The problem can be solved. Unfortunately, our leaders in Washington have not yet expressed any desire to take on the issue. That probably will not happen until the crisis arrives. How sad!
Stephen Slifer
NumberNomics
Charleston, S.C.

Such a clear analysis. Easily understandable and much appreciated. If only clear minded people could govern we could work our way out of this debt mess. I see little hope of a solution with the way our government is run (or not run) nowadays.
Excellent article as usual. However, I notice your Debt/GDP ratio is much lower than depicted at the St. Louis Fed site: https://fred.stlouisfed.org/graph/?graph_id=492610&rn=464
Perhaps you’re using an adjusted figure(s) in your calculation?
It is a bit discouraging, but we can always hope.
Hi Steve,
Thanks for your comment. The St. Louis Fed uses total debt to GDP. What I use is debt held by the public to GDP. I pick that up off of the Congressional Budget Office’s report on the budget. I use that particular measure because debt held by the public is the debt that is traded around in the market. Total debt includes a lot of government agency owned debt which just sits in that agency’s account. Here is a link to the budget data. Click on the 10-year budget projections. Then click on August 2019. It will pop up as Table 1-1. I hope this helps.