August 7, 2020
After shrinking by 32.9% in the second quarter we all want to know the extent of the GDP rebound in the third quarter. Is the economy recovering nicely? Or was its recent rebound buoyed by the $1,200 refund checks which means the economy could stall later this summer? How exactly are consumers responding to a faster rate of spread of the virus? Are we panicking, crawling back in our shell, and becoming unwilling to spend? Or are we largely shrugging it off? Because we have never dealt with a pandemic in the past 50 years there is a wide divergence of views. We remain optimistic for a variety of reasons.
When economists do GDP forecasts, we try to look at both the “production” and “demand” sides of the economy. To estimate the production side of the equation we look at employment and hours worked. Are businesses hiring new workers? Are they working their employees longer hours? Are they seeing higher orders? Are they boosting production? On the demand side we look at the pace of consumer spending, housing sales, and business investment. In theory, the two sides of the equation should be the same. But that never happens. These pieces of information come from different data streams and each one is subject to its own measurement problems. As we go back and forth between the two sides of the economy, we can get some sense of how things are shaping up.
Let’s start with the production side. What do we know? The economy created an additional 1,763 thousand jobs in July. While a smaller gain than in other recent months, that should have been expected. Prior to the recession the economy cranked out about 200 thousand jobs a month. If it can produce 1.0 million or more jobs in a single month, we should conclude that the economy is recovering nicely.
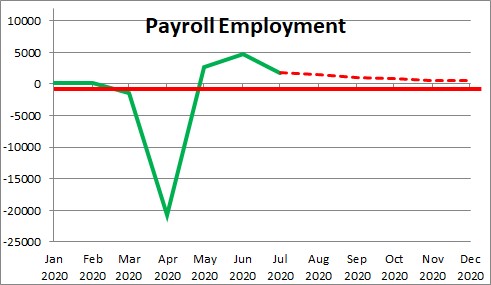
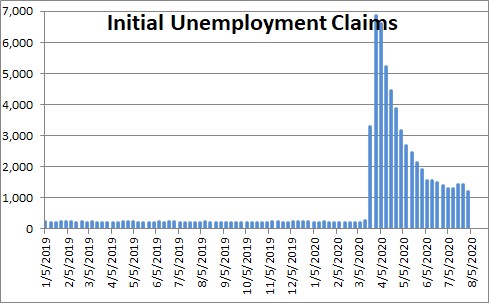
A leading indicator of the change in employment is initial unemployment claims (layoffs). After edging upwards for two weeks in the second half of July, claims plunged by 250 thousand in the first week of August and are now at the lowest level since they surged in March. The labor market is continuing to hold up well. We are expecting another 1,500 thousand increase in jobs in August.
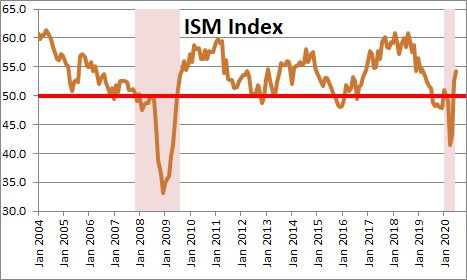
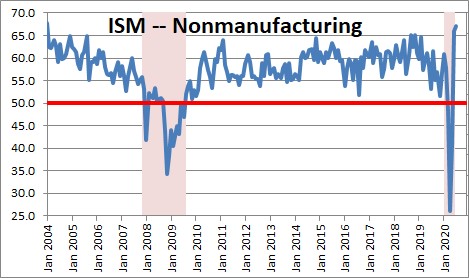
Also on the production side we might look at the manufacturing and non-manufacturing purchasing managers’ indexes. On the manufacturing side, after having plunged in April it has come roaring back — it rose 1.6 points in May, jumped 9.5 points in June, and climbed an additional 1.6 points in July. Its current level is the highest it has been since March of last year. Furthermore, the increases were led by the two leading components of the index – orders and production.
Ditto for the non-manufacturing side of the economy. In this case, the July level is the highest reading since 2004.
On the demand side, retail sales have been surging. After collapsing in March and April, sales came roaring back in May and June and are now at a record high level. So what is going to happen in July? It will climb further for a couple of reasons.
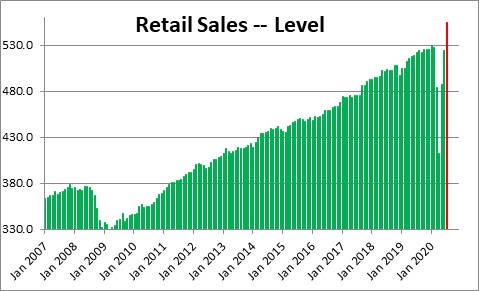
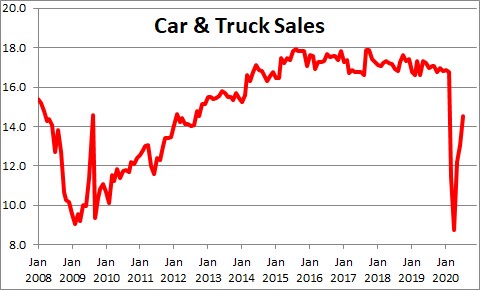
First, unit car sales rose 11.1% in July to a 14.5 million pace so this component of retail sales is going to rise. At the same time the economy generated 1,763 thousand new jobs. More people are working which generates income and allows consumers to keep spending.
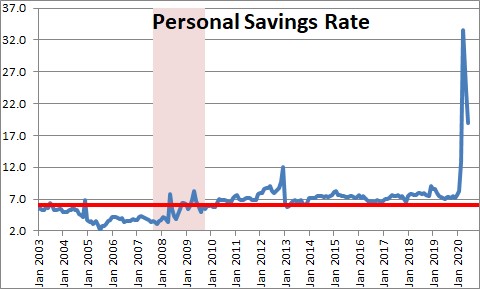
Finally, the $1,200 refund checks caused the savings rate to surge to 33.5% in April versus a more normal level of 6.0%. It has fallen back in May and June but remains at a lofty level of 19.0%. Consumers already have money in the bank to continue spending at a brisk pace for several more months. For what it is worth, we expect retail sales to rise 5.8% in July. If that happens, the level of sales which was at a record high level in June will eclipse that record in July.
Then there is housing. New home sales have rebounded and by June have bounced back to where they were in January.
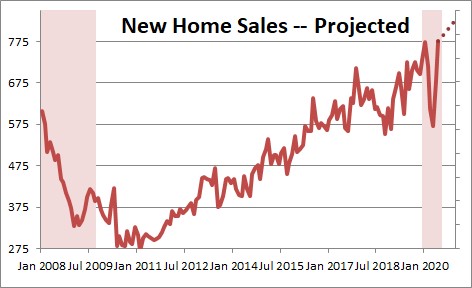
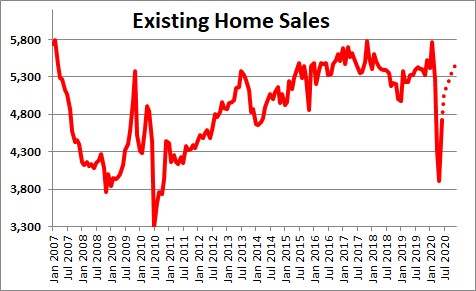
Existing home sales have only partially recovered by June, but pending home sales surged in June and that is a leading indicator of what is going to happen to existing home sales in July. With mortgage rates at 3.0% potential home buyers are on the prowl.
Any way we choose to look at this – production side or demand side – the economy remains on a solid upward trajectory. Every single economic indicator in the past three months has surprised on the upside and it appears the data for July and August will continue to be solid.
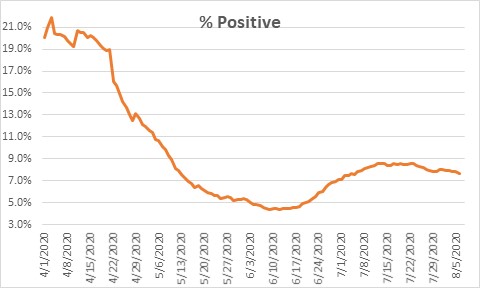
Finally, the media is focusing on the number of new cases which continues to climb. But at the same time the number of people getting tested also continues to climb. If we look at the percent of those cases that are positive, it has actually been inching its way lower from 8.5% in mid-July to 7.7%. The virus is not spiraling out of control as the media would lead us to believe although there are hot spots.
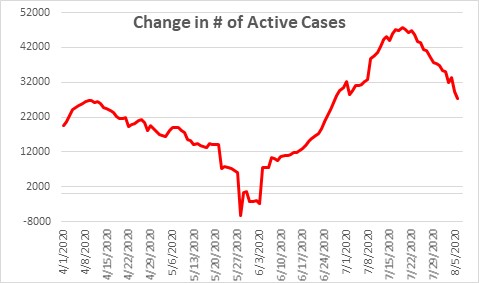
Keep in mind, too, that the number of active cases has been slowing. We care about that figure because this represents the number of people who can actually transmit the virus to others. If you get the virus, two things can happen – you can die, or you eventually recover. If either of those things happen, you can no longer spread the virus. Nobody talks about it, but record numbers of people are recovering from the virus. In mid-July the number of active cases was climbing by almost 50,000 per day. Today it is still rising but by 27,000 per day. That is not great because the virus continues to spread, but it is hard to argue that the situation is getting worse. Hopefully, the number of active cases will continue to shrink and eventually start to decline.
We are not arguing that everything is fine. It is not. But the economy thus far has recovered more quickly than expected, and it continues to recover. It is heading in the right direction at a brisk pace. There is no evidence that Americans are petrified of the virus and sequestering themselves in their homes. Quite the opposite.
Stephen D. Slifer
NumberNomics
Charleston, S.C.
Follow Me