July 5, 2024
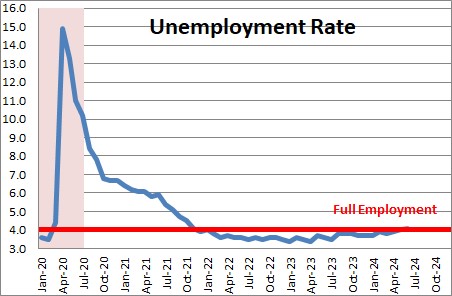
The unemployment rate rose 0.1% in June to 4.1% ((4.054%) after increasing 0.1% in May to 4.0% after having risen 0.1% in April to 4.0%. In June the labor force rose by 277 thousand.. Employment increased 116 thousand. As a result, the number of unemployed workers rose by 162 thousand and the unemployment rate rose 0.1% to 4.1%. In contrast, payroll employment rose by 206 thousand in compared to the 116 thousand increase in civilian employment.
How come the two estimates of employment are different? First, the two are figures are derived from separate data streams. The payroll number is calculated from employment numbers reported by a large number of employers across all industries. Employment for the unemployment rate calculation is derived from knocking on doors and asking people if they have a job. It is known as the household survey. It tends to be more volatile than the payroll employment data. One conceptual difference is that the household survey includes people who are self-employed which would not be captured in the establishment survey. In the end, there is always monthly noise between the two series. Over time the two surveys seem to show roughly comparable gains in employment.
In the wake of the Fed’s series of rate hikes the labor market is doing particularly well. The Fed considers full employment to be 4.0% which means that at that level everybody who wants a job has one, and that is almost exactly where the unemployment rate is currently. Ordinarily in that situation there would be some upward pressure on wages as firms bid against each other to get the required number of workers and as workers and unions try to offset some of the decline in real earnings that has occurred over the past two years. However, the influx of immigrant workers crossing the border from Mexico appear to taking some low-paying jobs as they begin to adjust to life in the United States which, in turn, is allowing hourly earnings to grow more slowly than had been anticipated.
While the official rate is the most widely used, the reality is that the official rate can be misleading because it does not include “underemployed” workers. There are two types of “underemployed” workers. First, there are people who have unsuccessfully sought employment for so long that they have given up looking for a job. Second, are those workers that currently have a part time position but indicate that they would like full time employment. The total of these two types of underemployed workers are “marginally attached” to the labor force. The number of these workers has risen in recent months as some people appear to have gotten a part-time job but would like a full-time position..
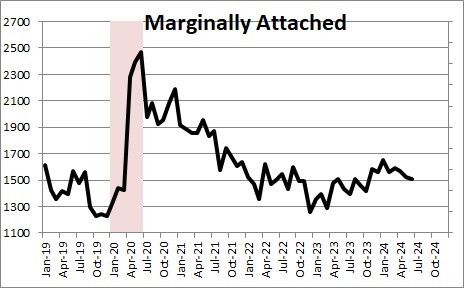
To incorporate the impact of these workers who are marginally attached to the labor force, we should probably be focusing on the broader measure of unemployment which was unchanged in June at 7.4%. Full employment for this measure of unemployment is somewhere around the 8.0% mark.

Given the steady gains in employment we look for GDP growth of 2.0% growth in the second quarter followed by GDP gains of 1.7% in both the third and fourth quarters.
Stephen Slifer
NumberNomics
Charleston, SC
Follow Me